Operations
NOC Command Center
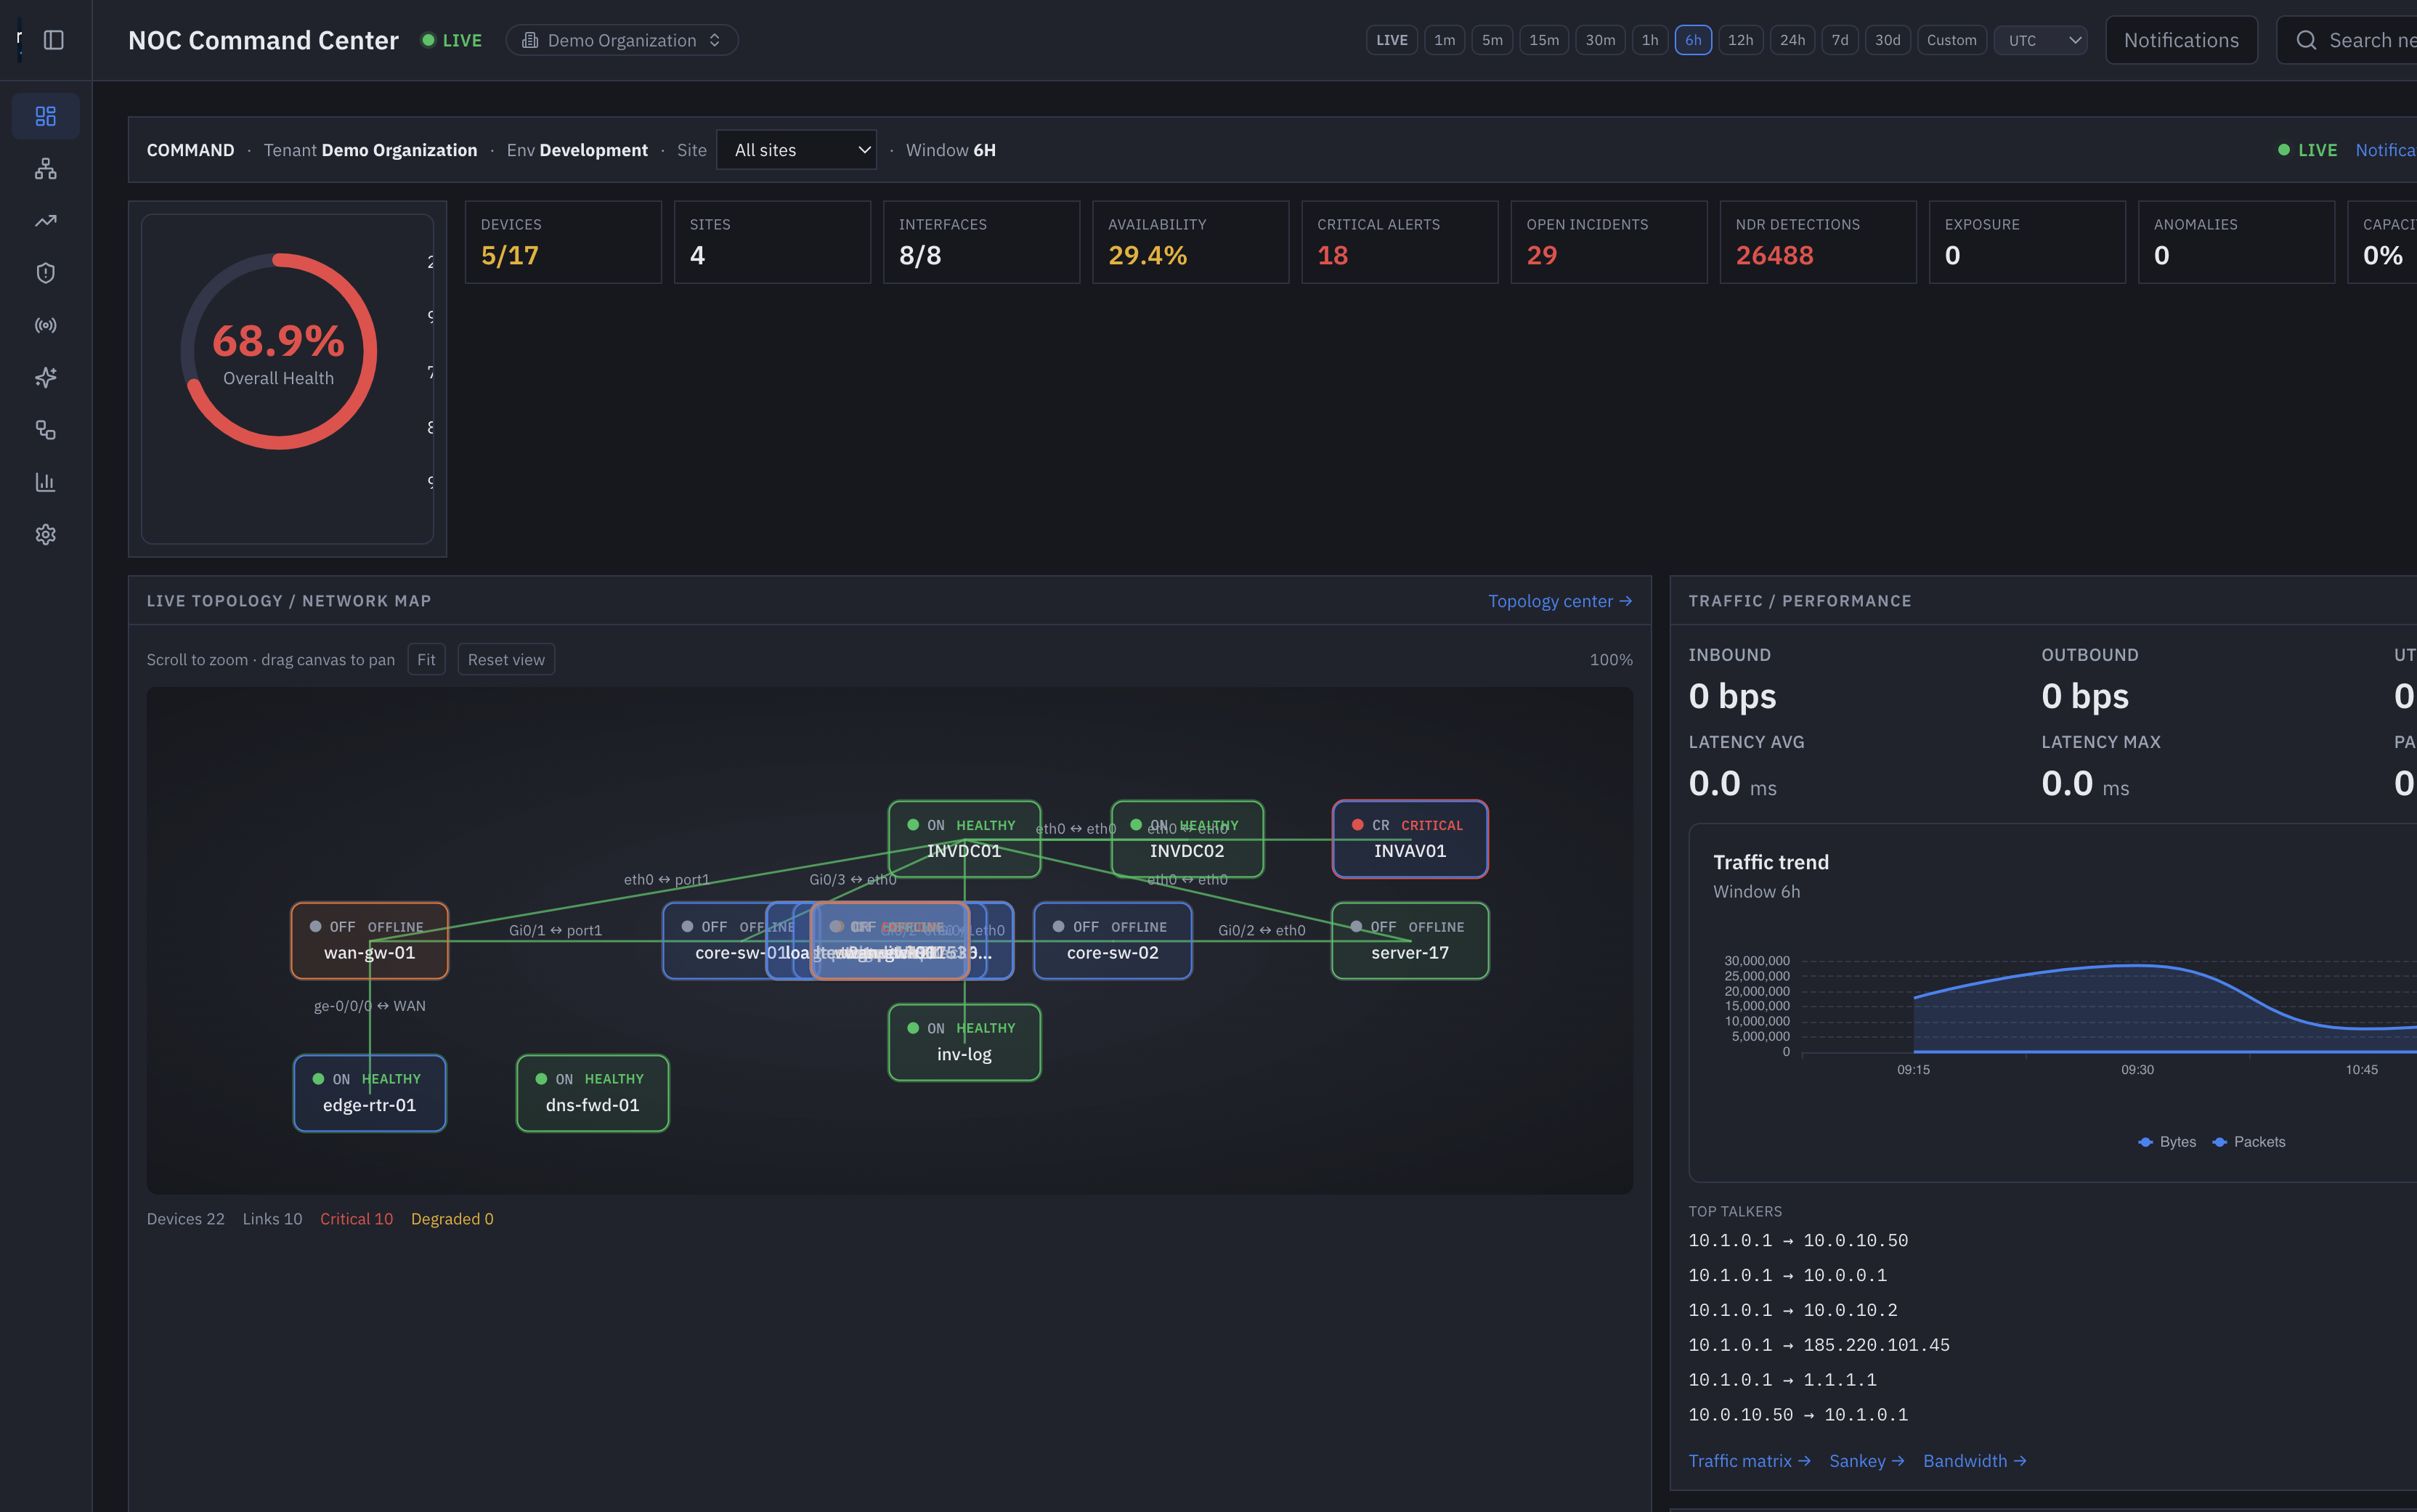
The live operating wall for Optima Pulse — health, topology, traffic, detections, incidents, and site status in one session.
Optima Pulse
What this capability delivers
Operator home screen
Overall health, device and interface counts, availability, critical alerts, open incidents, NDR detections, exposure, anomalies, capacity, and collector status are first-class KPIs — not a separate dashboard product.
Live topology
The command center embeds the network map with health overlays so a shift lead can go from a red count to a device without leaving the wall.
Action, not tabs
Top talkers, security ops, incident workspace, and event log are one click from the same command view.
Next step