01
See it
Command center health, topology, syslog, traps, and collector status tell you what changed across sites.
One platform for NMS, NDR, NEM, AIOps, and network automation. See device and path health, understand traffic and detections, and act before users are impacted.
Optima Pulse is built for NOC, SOC, enterprise, and MSP/MSSP teams that run real networks. Site-bound edge collectors feed inventory, metrics, flows, syslog, and traps into a tenant-isolated control plane. Empty telemetry stays empty — the UI never invents green.
How operators use Pulse
Monitor the estate, analyze the evidence, and act with approvals — on the same inventory, topology, flow, and detection graph.
01
Command center health, topology, syslog, traps, and collector status tell you what changed across sites.
02
Open the device, the host graph, the conversations, and the matching NDR detection instead of exporting a PCAP first.
03
AIOps RCA and Copilot sit on inventory, topology, flows, and detections — not a generic chatbot.
04
Incident workspace, playbooks, and approval-gated automation turn the next step into an auditable action.
Everything in the product
These are the modules operators actually open. Each card maps to a live Optima Pulse route, not a placeholder capability name.
Command Center
One live operating picture for health, topology, traffic, detections, incidents, and site status — built for operators who cannot context-switch across six tools.
NMS
Edge-collected SNMP, ICMP, syslog, and trap telemetry into a real inventory with device lifecycle, groups, dependencies, and explainable health.
Traffic & Flow
Turn high-volume flow telemetry into conversations, top talkers, application demand, traffic matrices, and Sankey paths operators can actually use.
NDR
Detect, investigate, and respond on network telemetry — sessions, detections, hunting, evidence, and action — without pretending to be a SIEM or EDR.
AIOps
Correlate noise, surface anomalies, trace likely root cause, and ask the AI Network Command Center for the next operational step.
Automation
Turn repeatable NOC and NDR decisions into playbooks, approvals, jobs, and auditable execution — with human control on sensitive changes.
Topology
LLDP/CDP discovery, inventory sync, and NetFlow conversations on one map so a red device opens into peers and paths instead of a static drawing.
NEM
Inventory internet-facing risk, vulnerabilities, misconfigurations, and attack paths on the same graph the NOC already uses.
Analytics
SLA, capacity, traffic, and NDR activity from VictoriaMetrics and ClickHouse — the same stores operations already trust.
Command Center
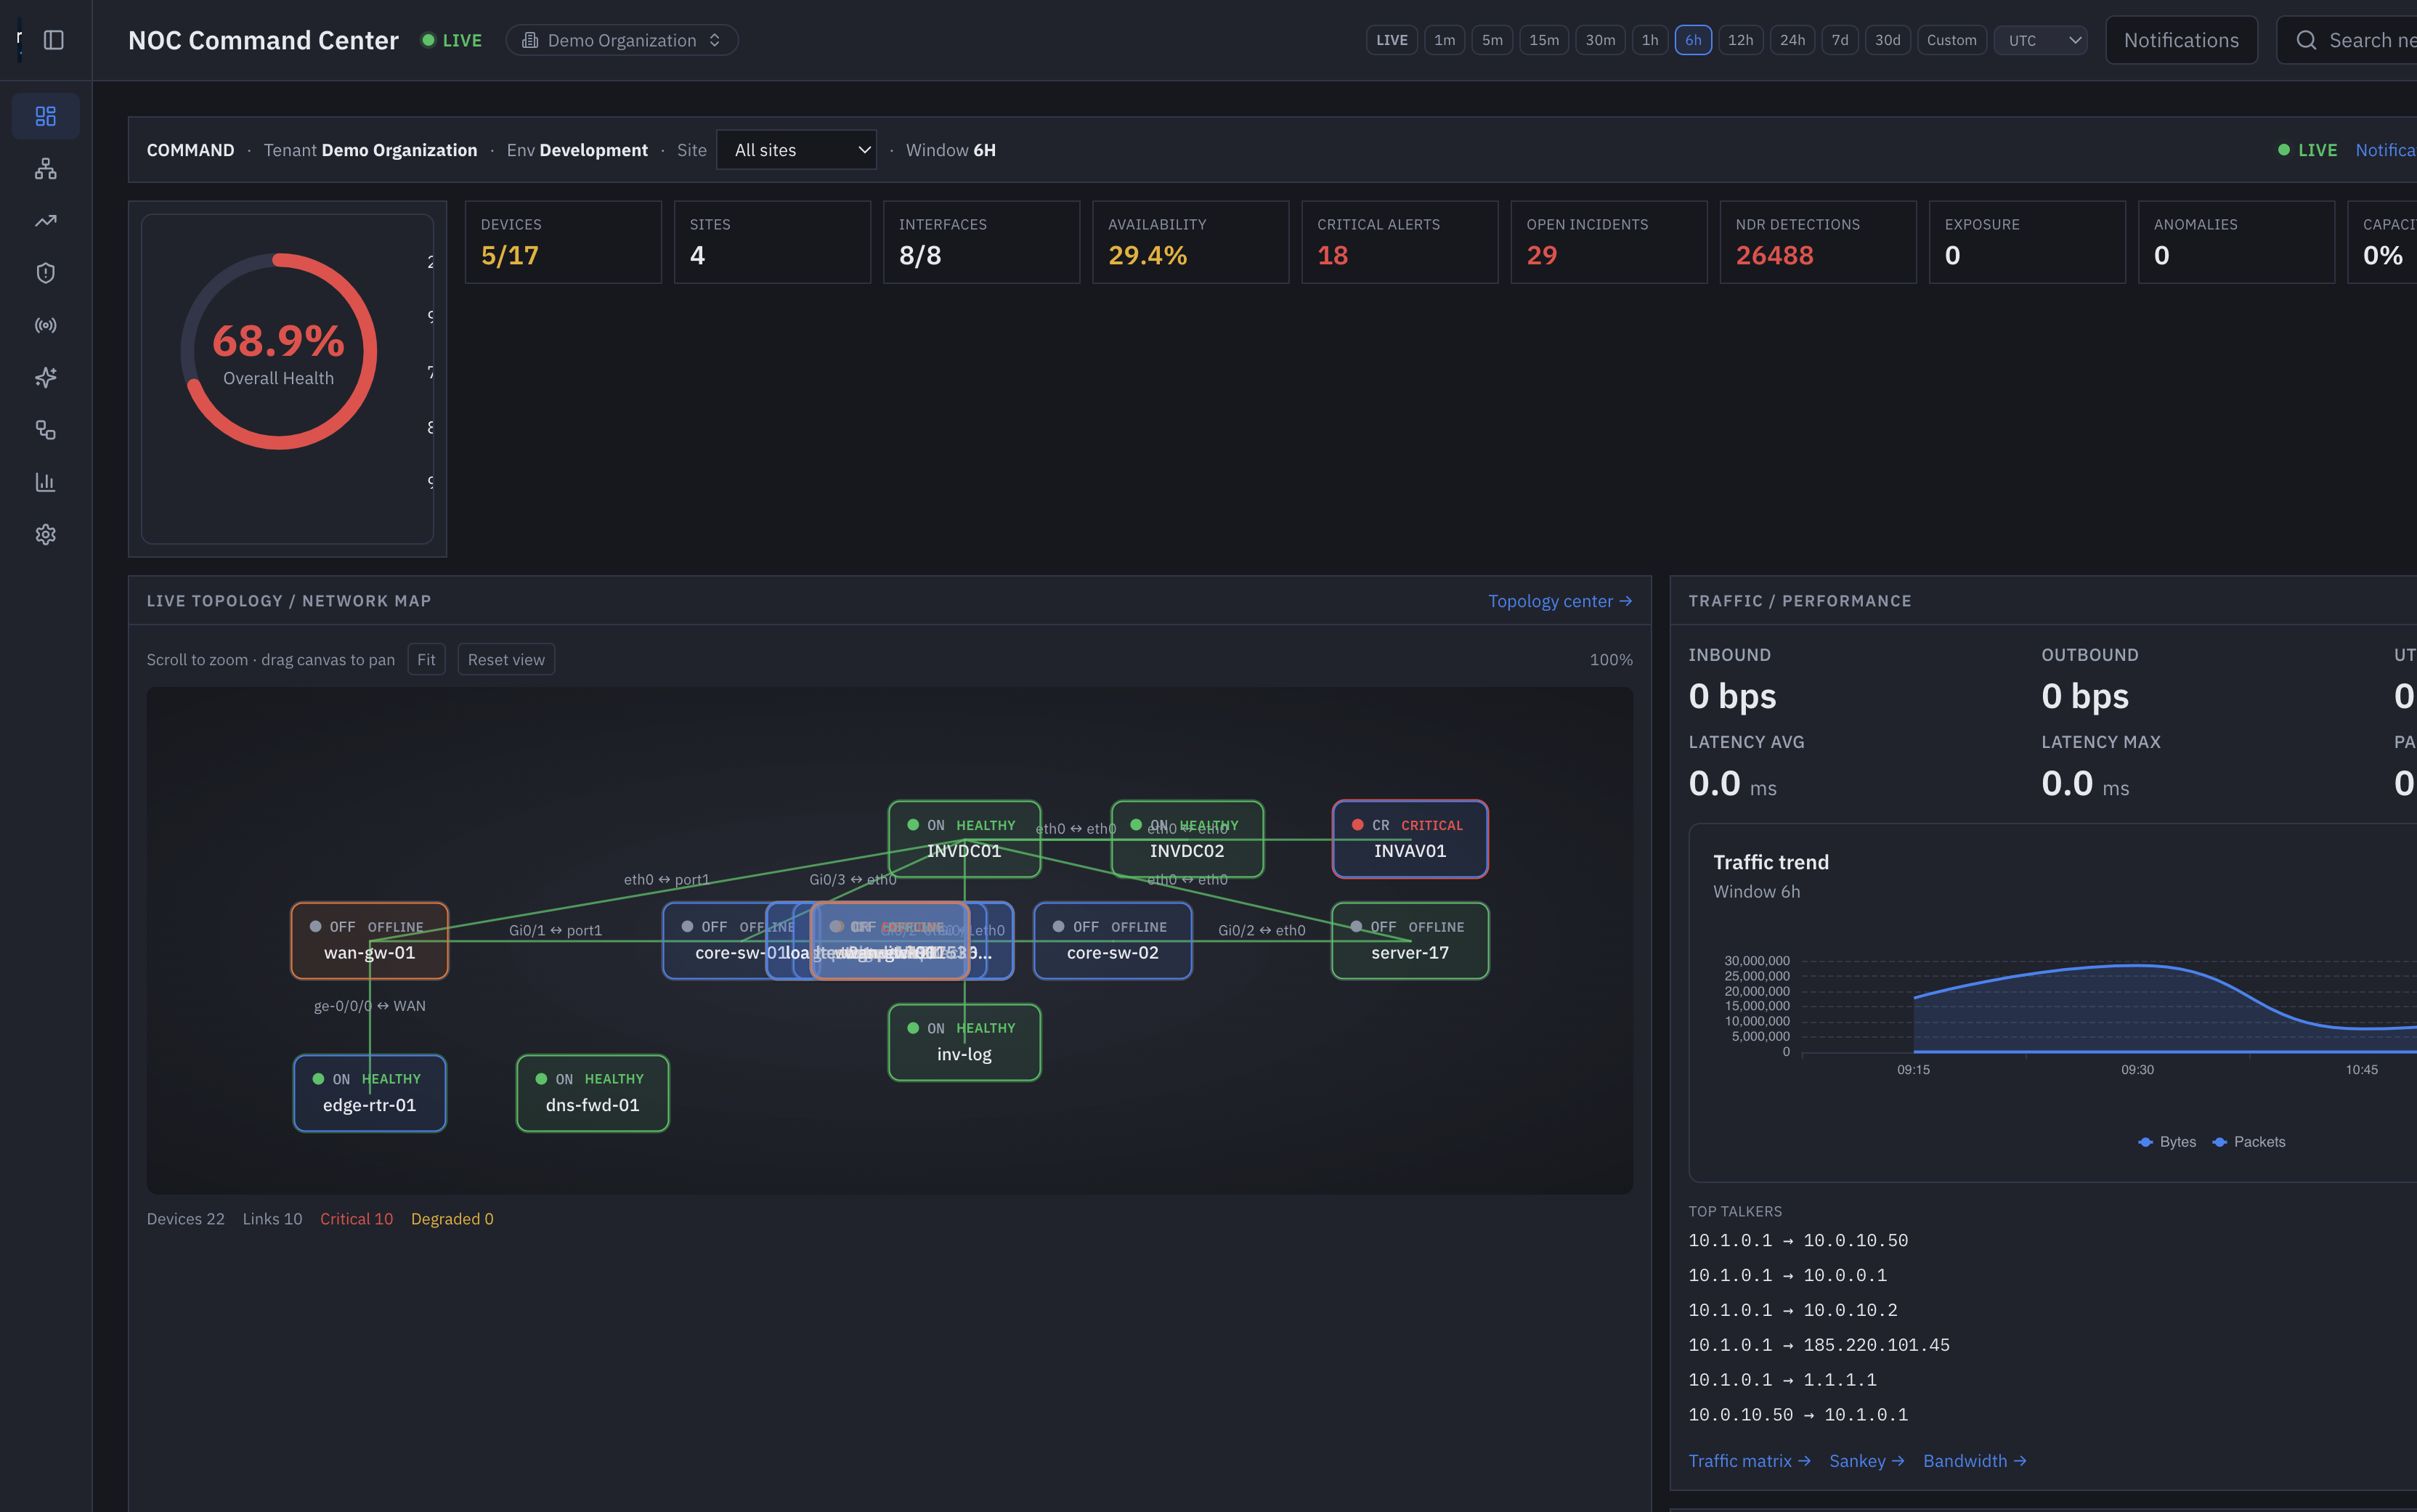
Overall health, devices, sites, interfaces, availability, critical alerts, open incidents, NDR detections, collectors, live topology, top talkers, and the incident stream share one session.
Overall health, devices, sites, interfaces, availability, and collector status from the same session — not a second dashboard product.
Device and link health on the operating map so a shift lead can go from a red count to a node without leaving the wall.
Inbound/outbound volume, latency, and top conversations from ClickHouse flows, with pivots into matrix, Sankey, and bandwidth views.
Critical alerts, open incidents, NDR detections, exposure, and anomalies sit on the same clock as device health.
Filter the command center by site — Dubai HQ, London DC, branch, lab — without changing tenant or tool.
A dedicated wall layout for the operations room, plus incident workspace and event log one click away.
Enterprise NMS
SNMP, ICMP, syslog, and traps run on site-bound collectors. Inventory and health live in Postgres; metrics land in VictoriaMetrics. Pulse does not invent green when there is no series.
SNMP, ICMP, syslog, and traps run on site-bound collectors. Poll targets come from the control plane; telemetry posts back over authenticated channels.
Discovered → registered → monitored → maintenance → decommissioned. Poll intent is explicit. Decommissioned devices are not quietly left green.
Health factors include status, alerts, telemetry freshness, interface state, and lifecycle. Missing VictoriaMetrics series is a valid state.
Continuous inventory of devices and relationships. Promote into monitoring only when a collector can actually poll the target.
Device groups, dependencies, monitoring profiles, and synthetic checks keep NOC policy out of spreadsheets.
Interface inventory, utilization, and collector health are first-class — not hidden behind a device detail page.
Topology and traffic
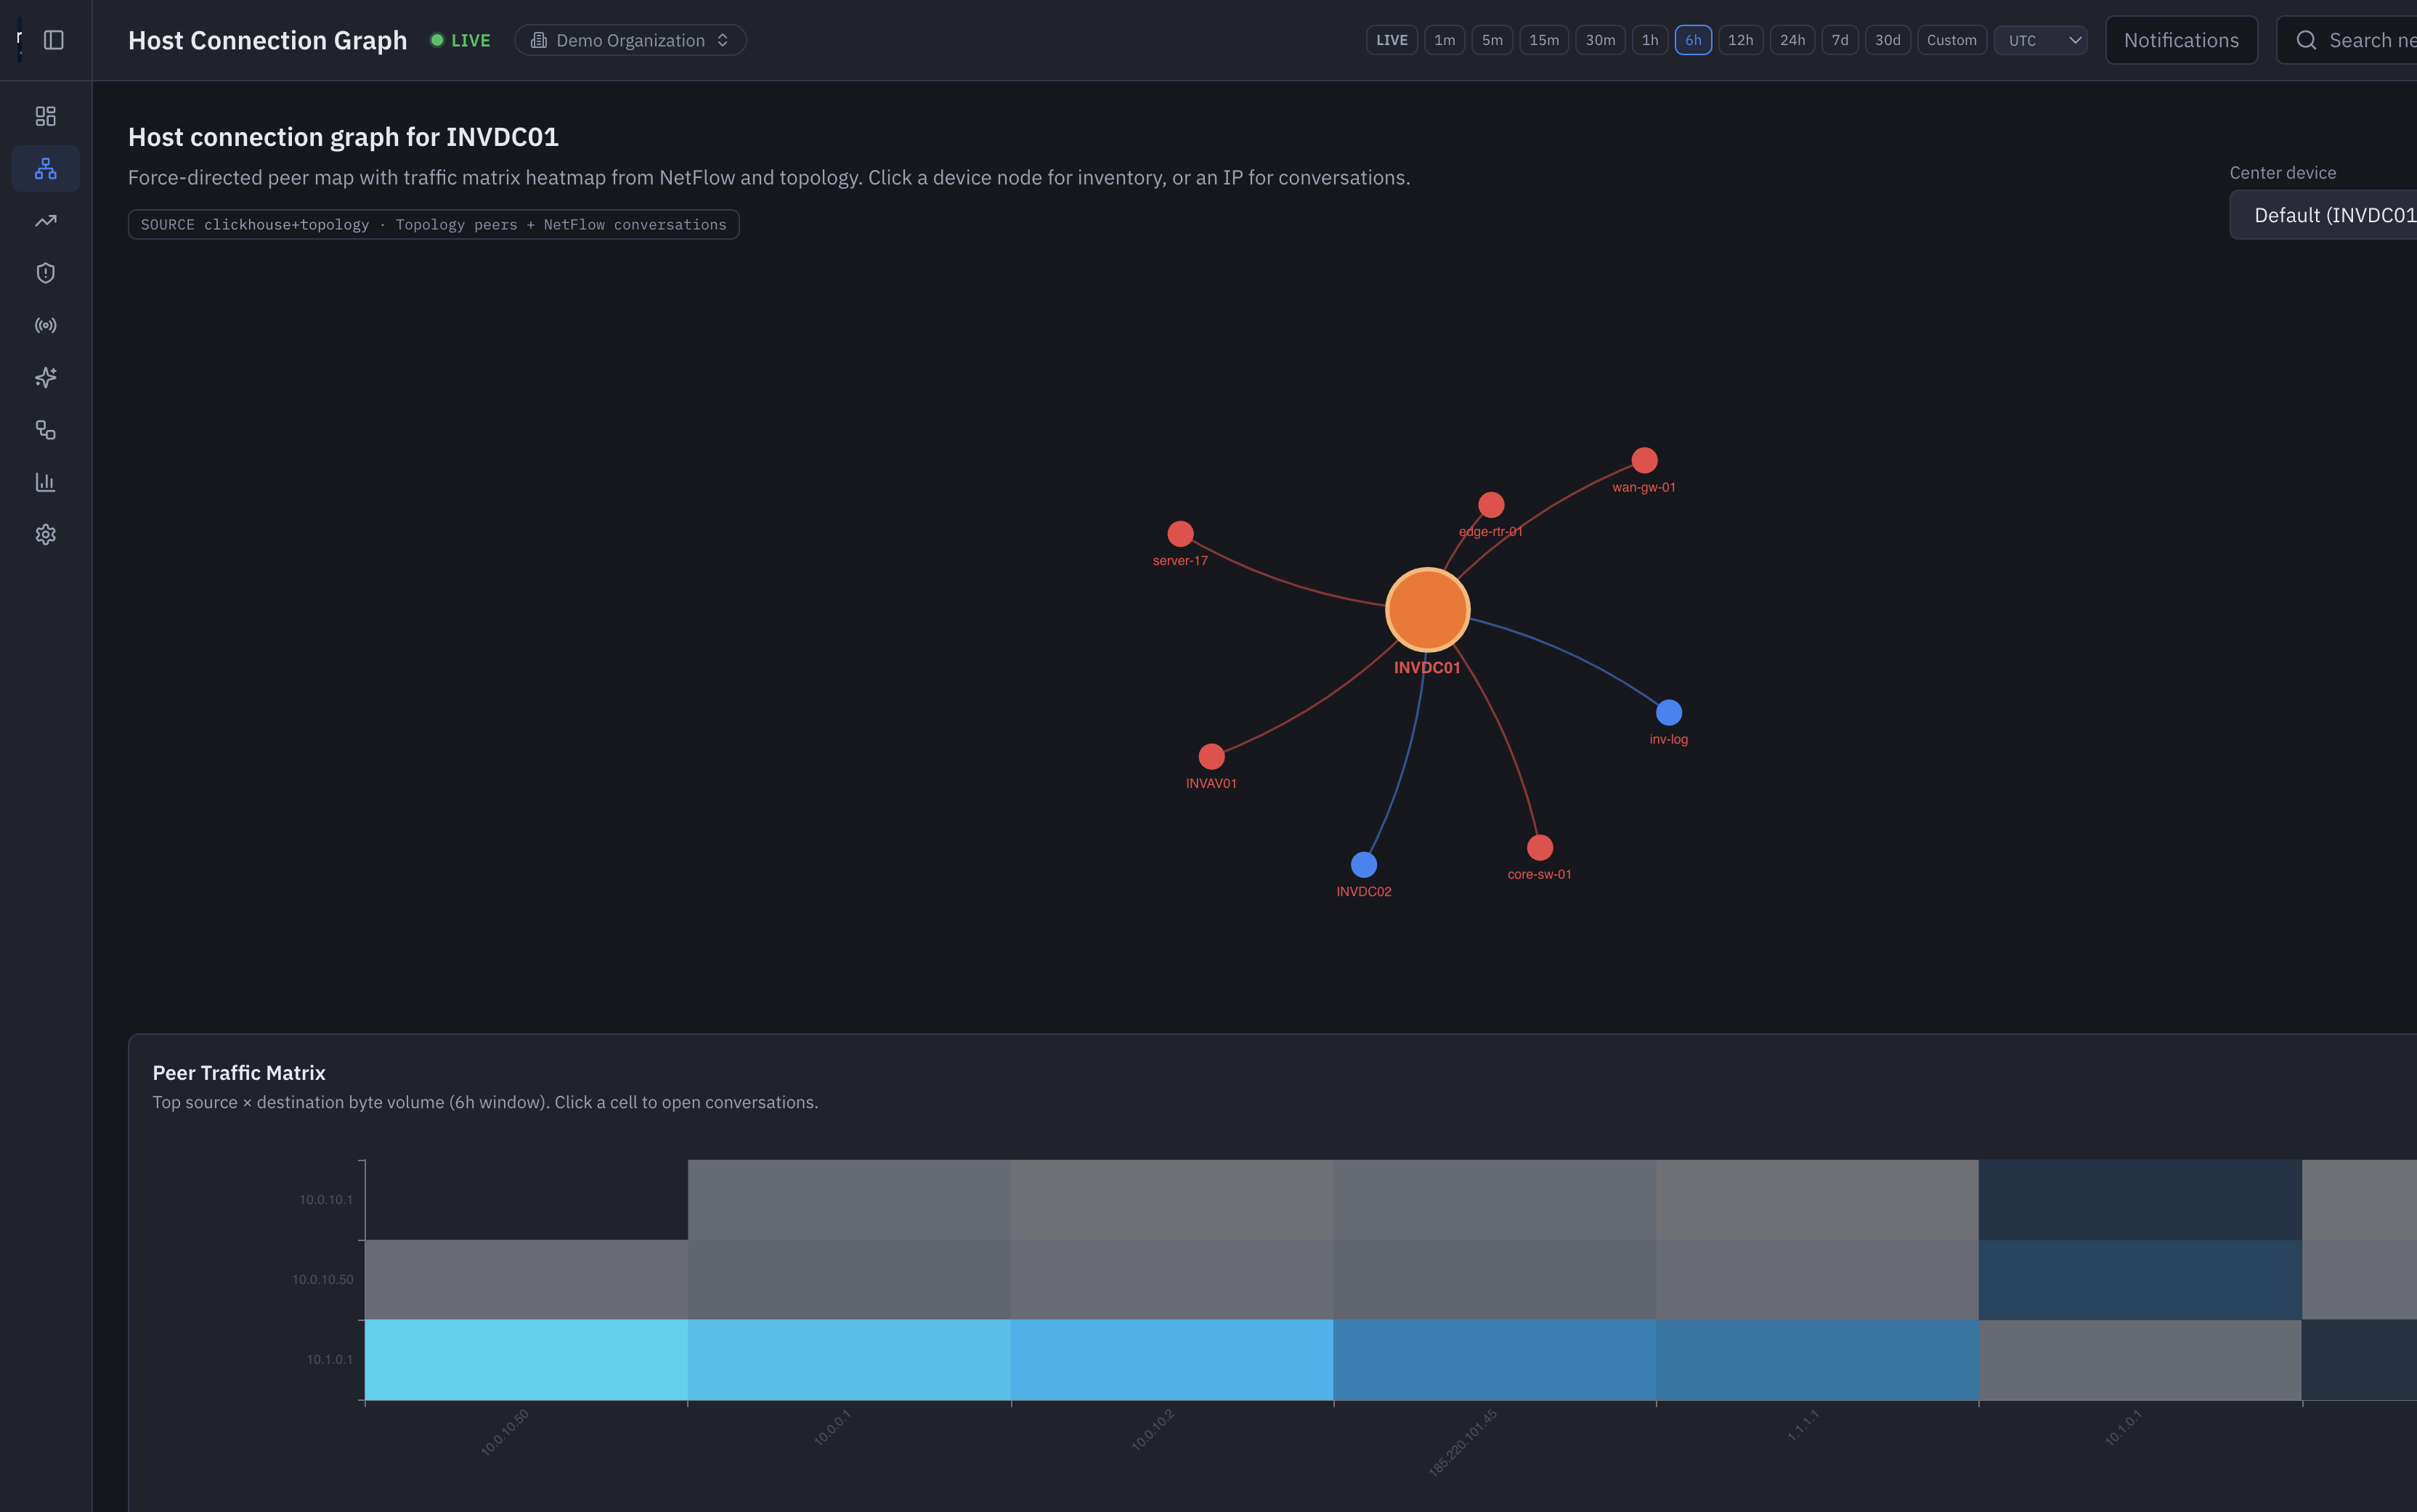
Live topology, unified graphs, and host-centered peer maps combine LLDP/CDP discovery with inventory. Traffic motion follows real interface utilization. NetFlow, IPFIX, and sFlow land in ClickHouse.
Network Detection and Response
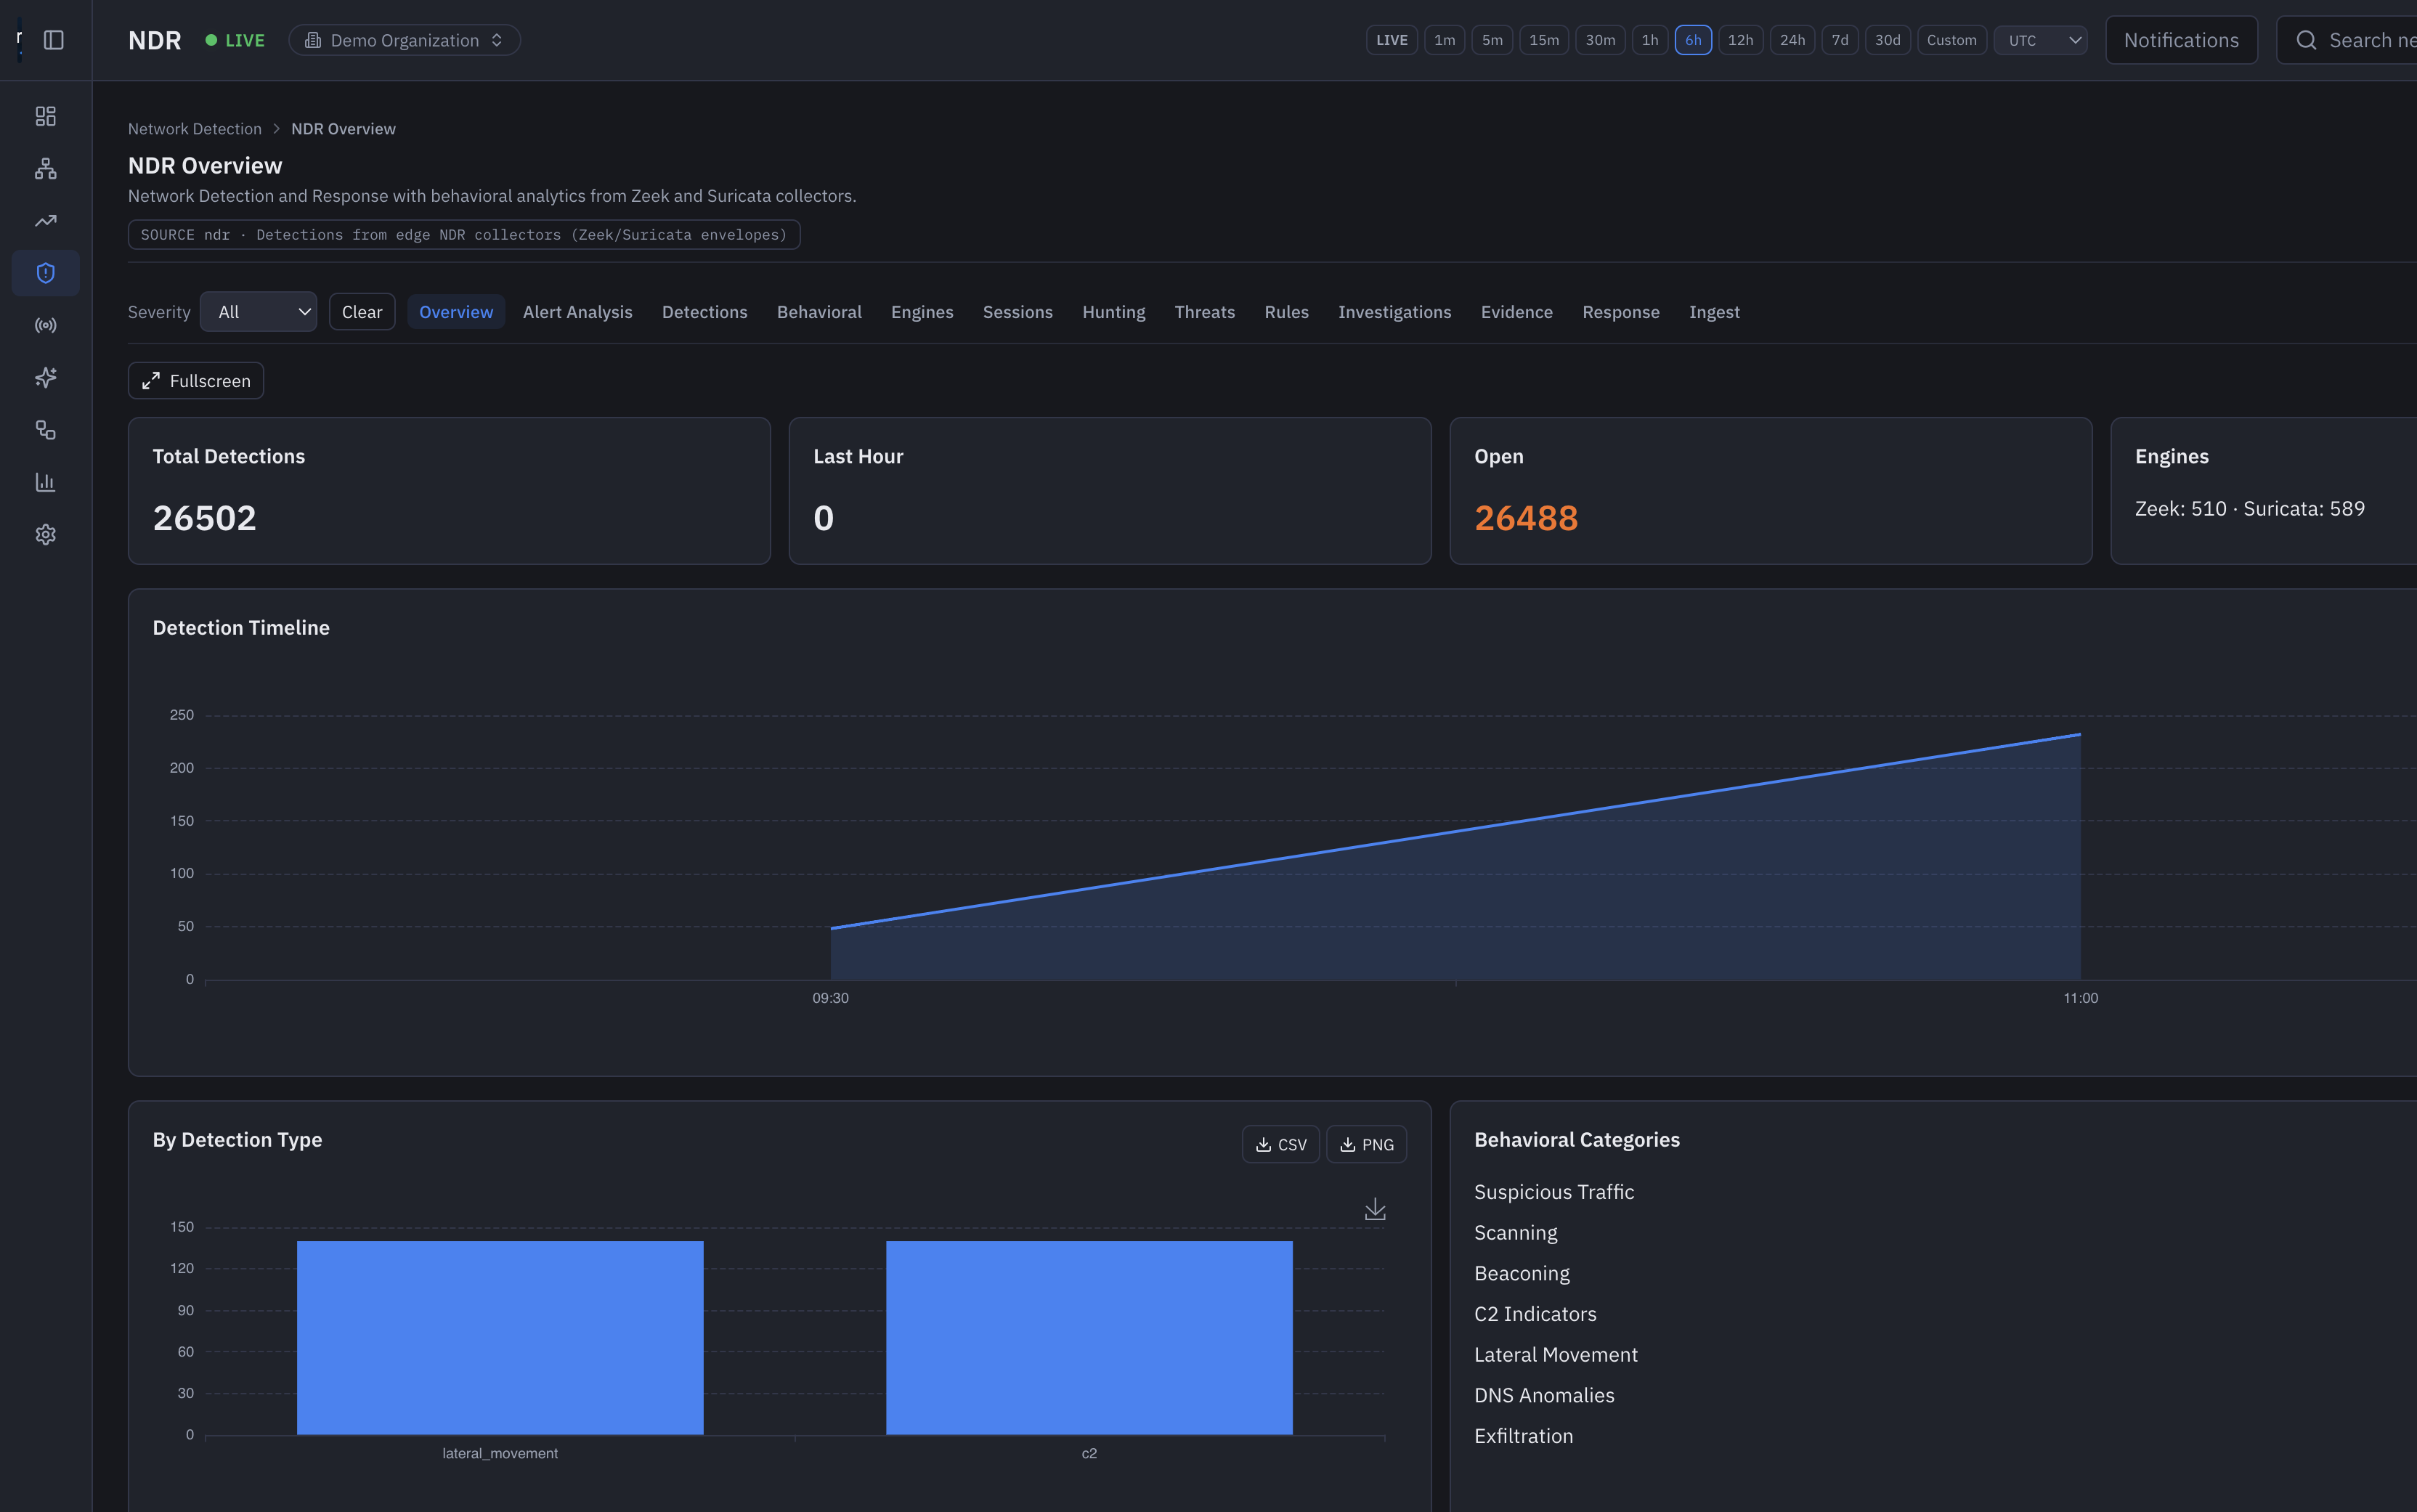
Detect, hunt, attach evidence, and respond on network telemetry. Pulse NDR is network detection and response. It is not a SIEM, SOAR, or EDR substitute.
Flows and sessions in ClickHouse feed NDR workers. Threshold, IOC, and behavioral rules upsert detections by fingerprint with explainable risk.
Alert analysis, detections, sessions, hunting, threat intelligence, rules, investigations, evidence, ingest, and response under one NDR module.
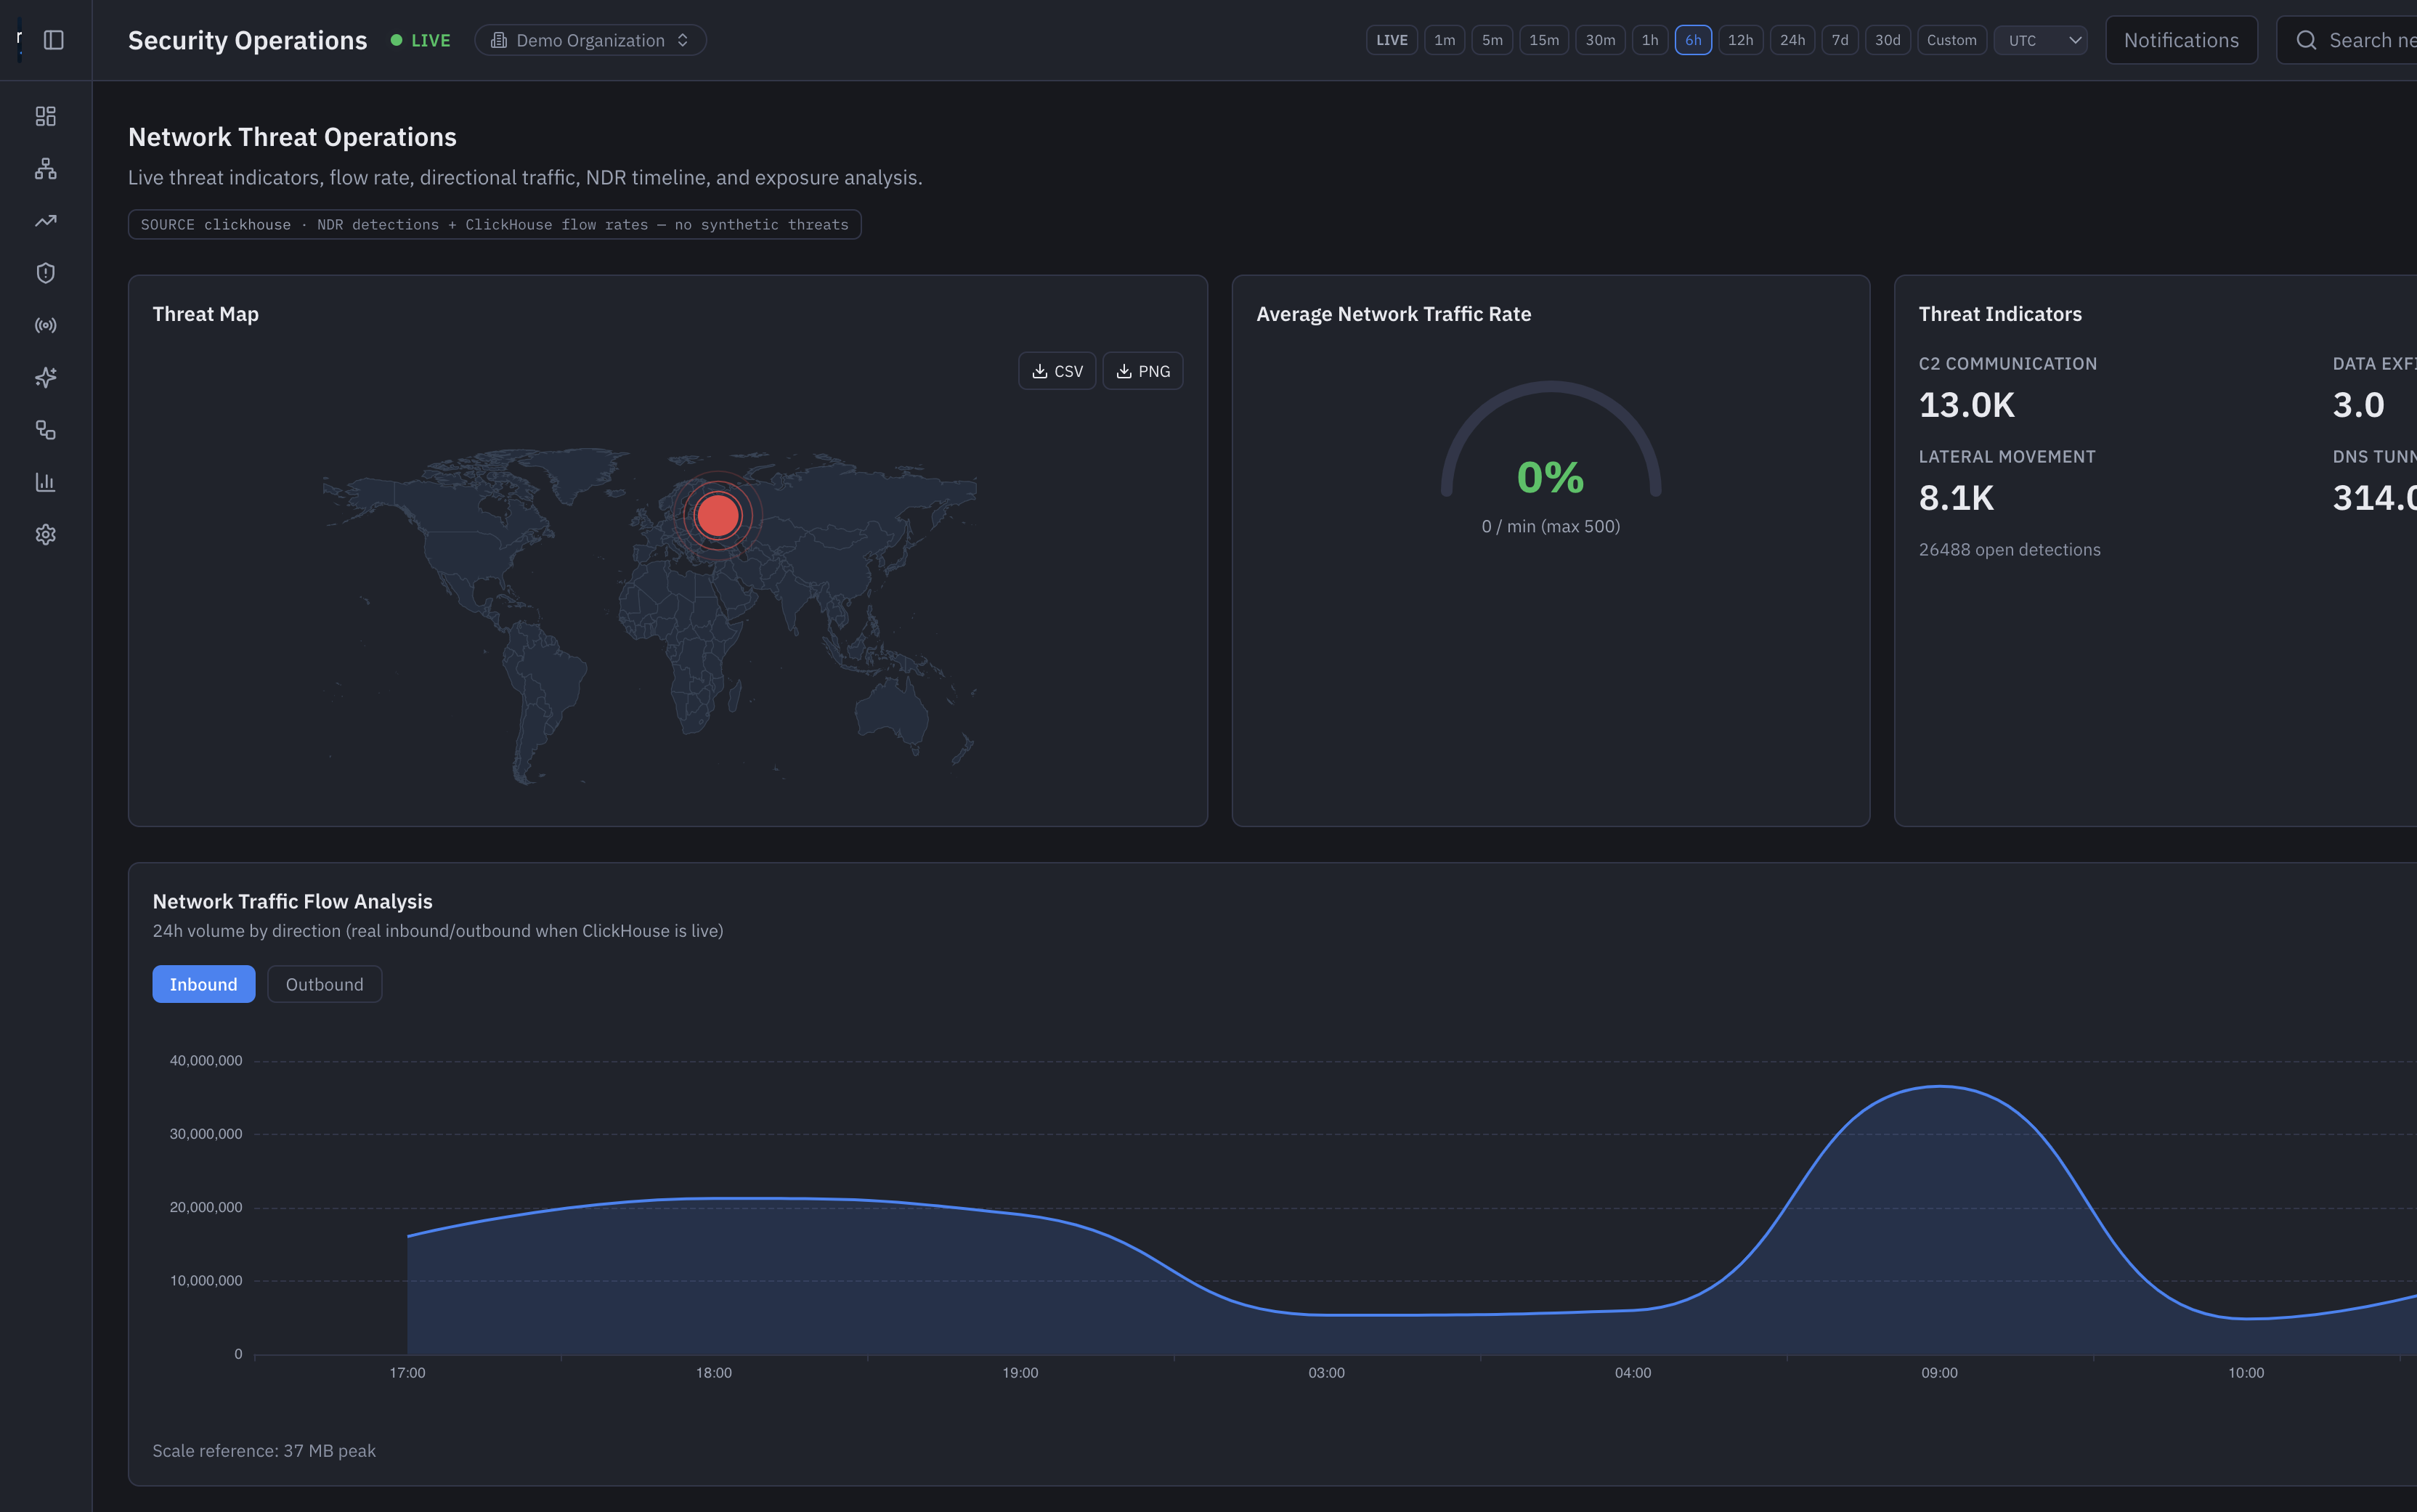
Threat map, indicator volume (C2, lateral movement, exfiltration, DNS tunneling), and inbound/outbound traffic beside open detections.
No TI feed configured stays visible. Insufficient graph evidence is stated — Pulse does not draw a fake attack path.
Security operations
SOC and NOC share the same incident clock. Geo threat context, C2 / lateral movement / exfiltration indicators, and inbound versus outbound volume sit beside open detections.
AIOps, Copilot, and automation
AIOps, RCA, and Copilot sit on inventory, topology, flows, and detections. Automation turns repeatable NOC and NDR work into playbooks, jobs, and approvals.
AIOps
Anomaly detection, noise reduction, forecasting, service impact, and root-cause views that follow the chain from application to host to uplink.
Copilot
Ask for investigation summaries and recommended actions grounded in the same operational graph operators already trust.
Automation
Enrichment, notifications, NDR response, and remediation become consistent execution. Sensitive changes stay behind approvals and show up in history.
Reporting and analytics
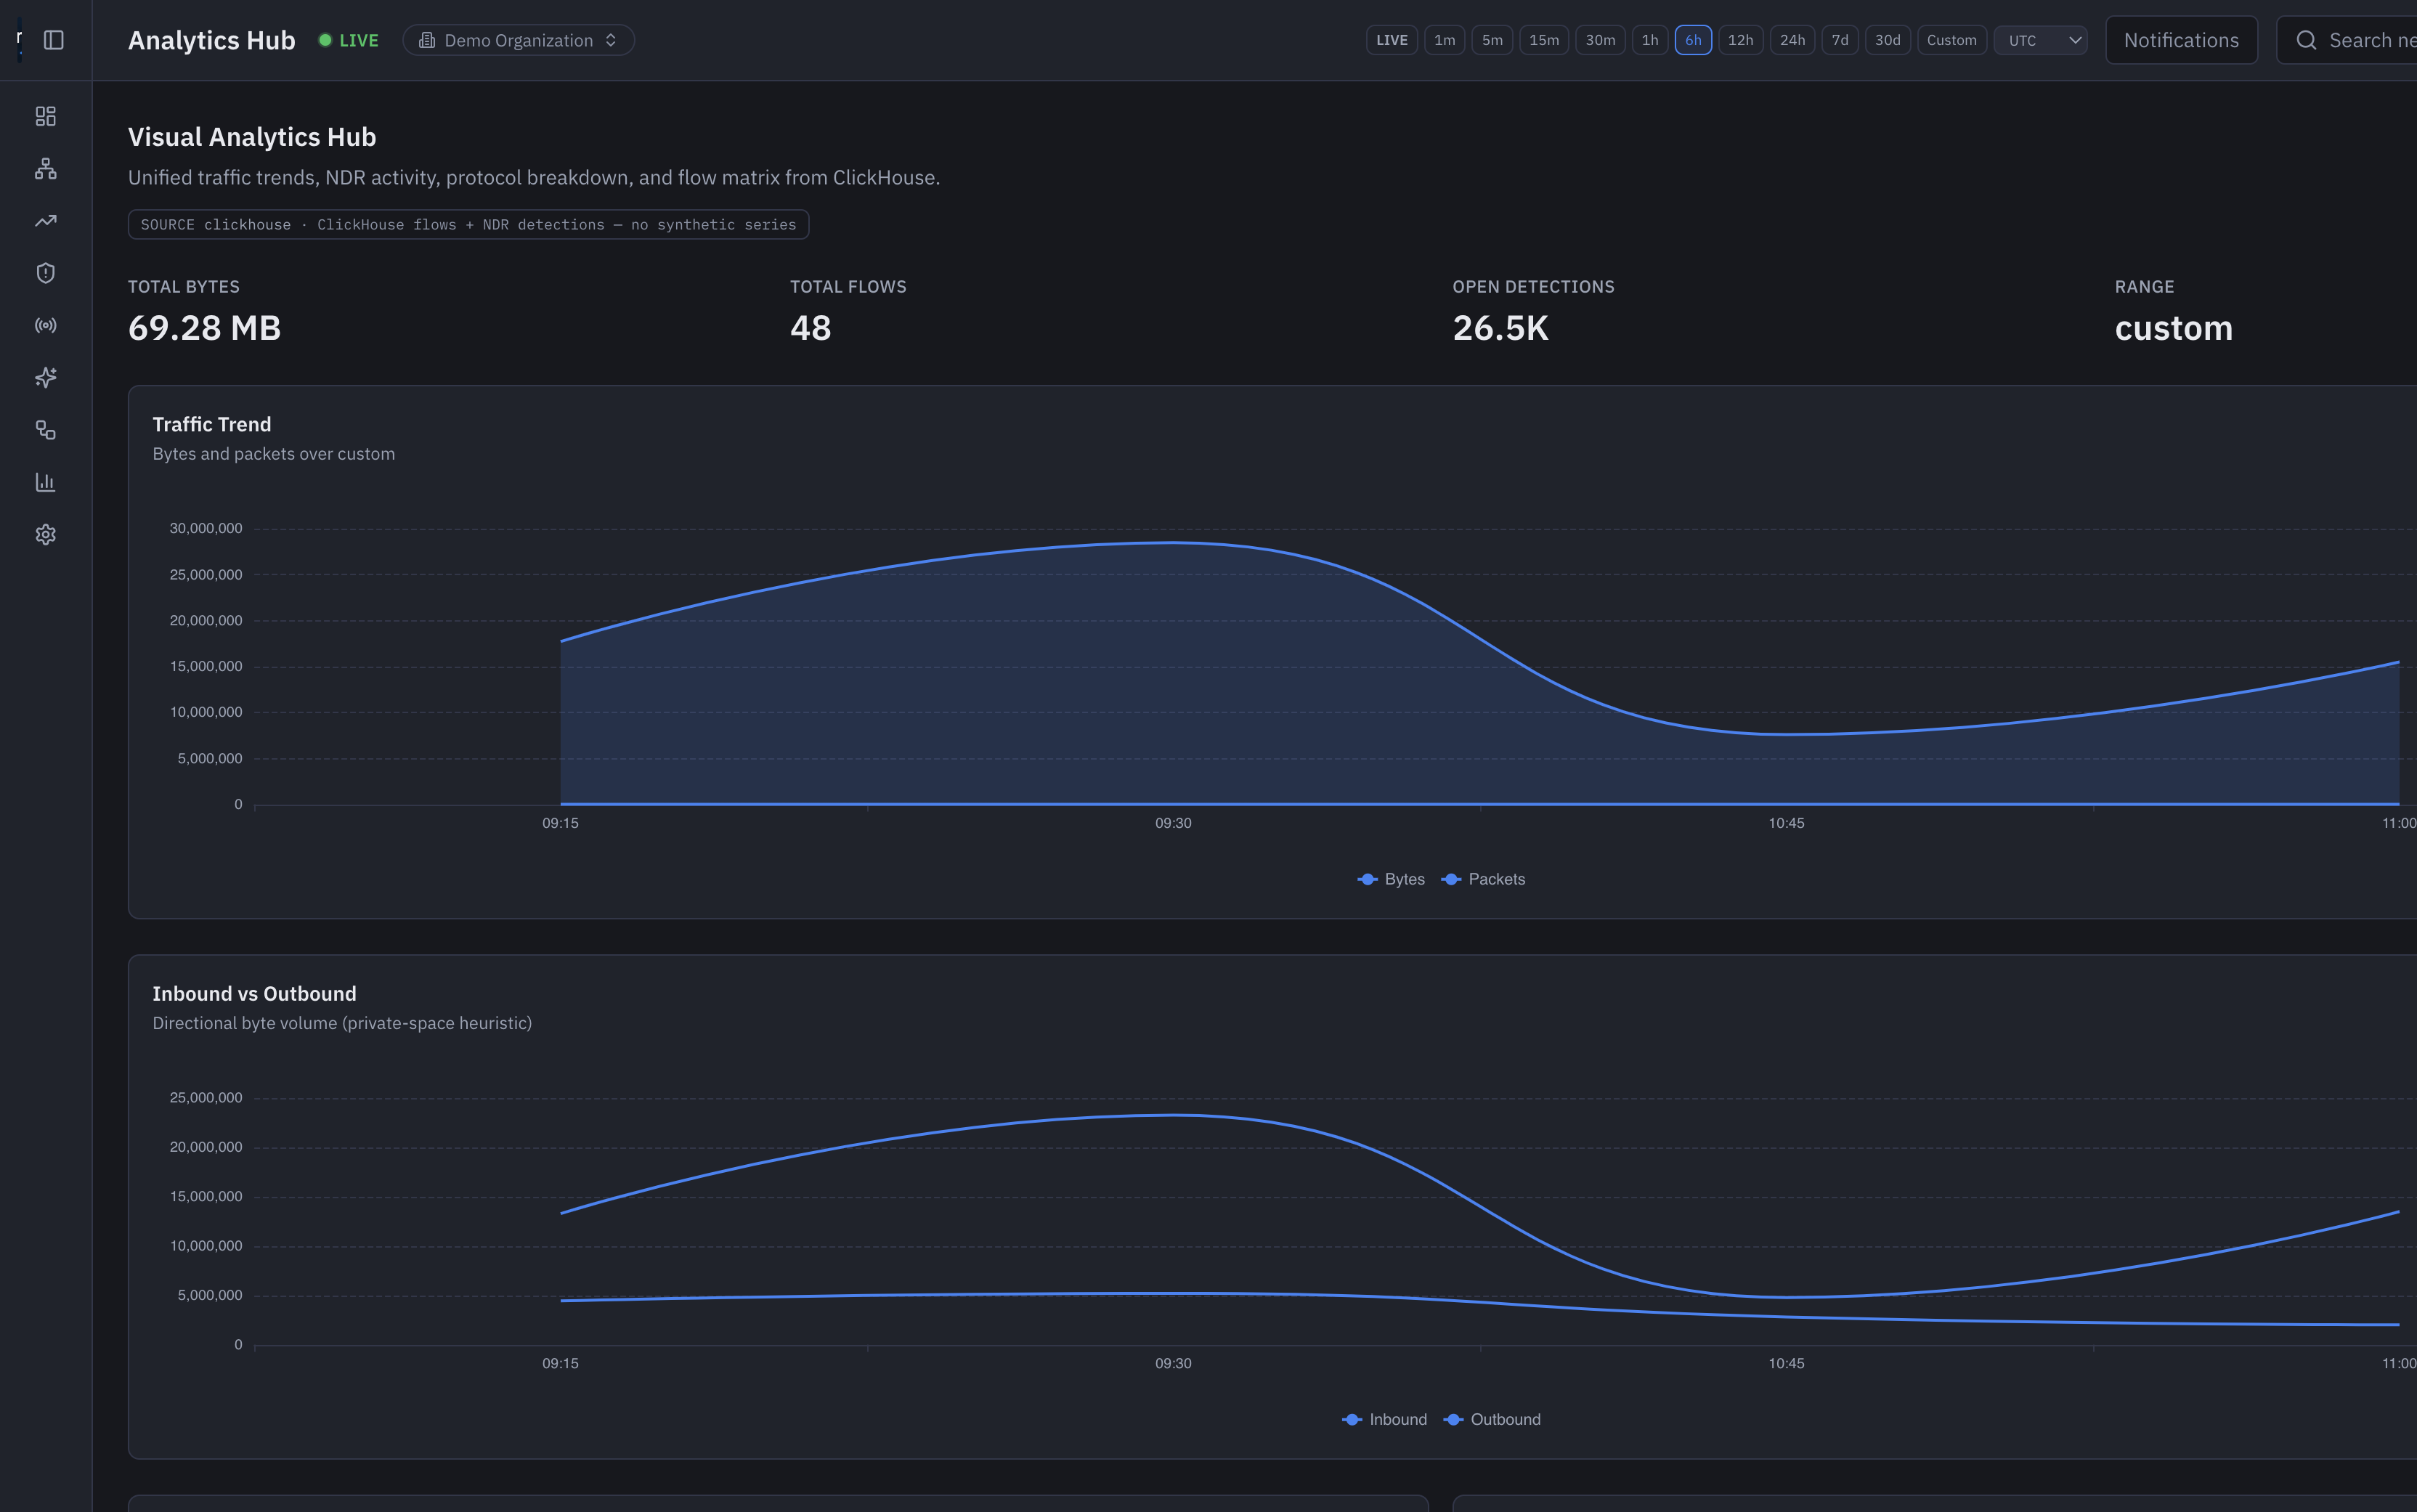
The analytics hub, bandwidth, bottleneck, SLA, and capacity views read VictoriaMetrics and ClickHouse. Leadership does not wait on a weekend CSV export.
Capabilities
From command center to response — every capability below is a real product module with its own page.
Operations
A live command wall for health, topology, traffic, detections, and incidents.
Visibility
Monitor devices, interfaces, collectors, and lifecycle across every site.
Inventory
Discover devices, relationships, and site inventory as the network changes.
Mapping
See how sites, switches, hosts, and paths connect with live health overlays.
Operations
Track latency, loss, WAN paths, and application experience before users feel it.
Network data
See who is talking to whom, which applications consume bandwidth, and where traffic is shifting.
Telemetry
Correlate flow telemetry into patterns for troubleshooting, hunting, and capacity.
Security
Detect suspicious traffic, hunt sessions, gather evidence, and drive response from the network.
NEM
Inventory internet-facing risk, vulnerabilities, misconfigurations, and attack paths.
AI
Turn noise into action with correlation, baselining, RCA, and recommended next steps.
Intelligence
Detect behavior changes earlier with baselines and network-aware signal correlation.
Diagnostics
Trace degraded service paths from user impact back to the likely failure domain.
Actions
Turn repeatable operational decisions into playbooks with approval gates.
Insights
Executive views, SLA analytics, capacity forecast, and operational reports from the same data.
Who Pulse is for
One control plane, different operating rhythms. Multi-tenant RLS and RBAC keep customer and team boundaries server-side.
Unified visibility across campus, WAN, data center, cloud links, and critical sites.
Command-center operations for incidents, health, and fast event triage.
Network detection, hunting, evidence, and response for security operations.
Multi-tenant operations with customer views, delegated access, and service reporting.
Track core paths, east-west traffic, and performance hotspots in high-density environments.
Keep branches, campus, cloud, and remote operations visible from one command center.
Industries
Healthcare, finance, government, telecom, manufacturing, retail, education, and technology teams use Pulse when connectivity, detection, and uptime are operational.
Mission-critical connectivity and clinical application continuity across facilities.
Availability for transactions, branch connectivity, and critical infrastructure reliability.
Distributed infrastructure monitoring for resilient public-sector networks.
Network performance, traffic intelligence, and service health across provider environments.
Plant connectivity, OT/IT awareness, and resilient operations across distributed sites.
Branch and WAN visibility for point-of-sale, applications, and store continuity.
Campus-wide connectivity for staff, students, and learning-critical services.
Cloud and data center visibility for modern digital operations.
Architecture
Collectors at the site. Go API with Postgres RLS. VictoriaMetrics for metrics. ClickHouse for flows. NATS for realtime. The console is not a refresh loop against the database.
Deployment
The control plane can live in Pulse Cloud or in your environment. SNMP, ICMP, syslog, traps, and flow collection run on site-bound edge collectors with mTLS.
SaaS
Operators use Pulse Cloud while site-bound collectors gather telemetry from distributed networks.
On-prem
Run the full control plane in your environment — API, stores, workers, and collectors — with offline-capable packaging.
Hybrid
Keep sensitive collection at the edge, apply residency controls, and operate from a central Pulse command center.
Ready to see Optima Pulse?
Walk the command center, NMS, topology, flow, NDR, and automation against your operating model — SaaS, on-prem, or hybrid.