Command Center
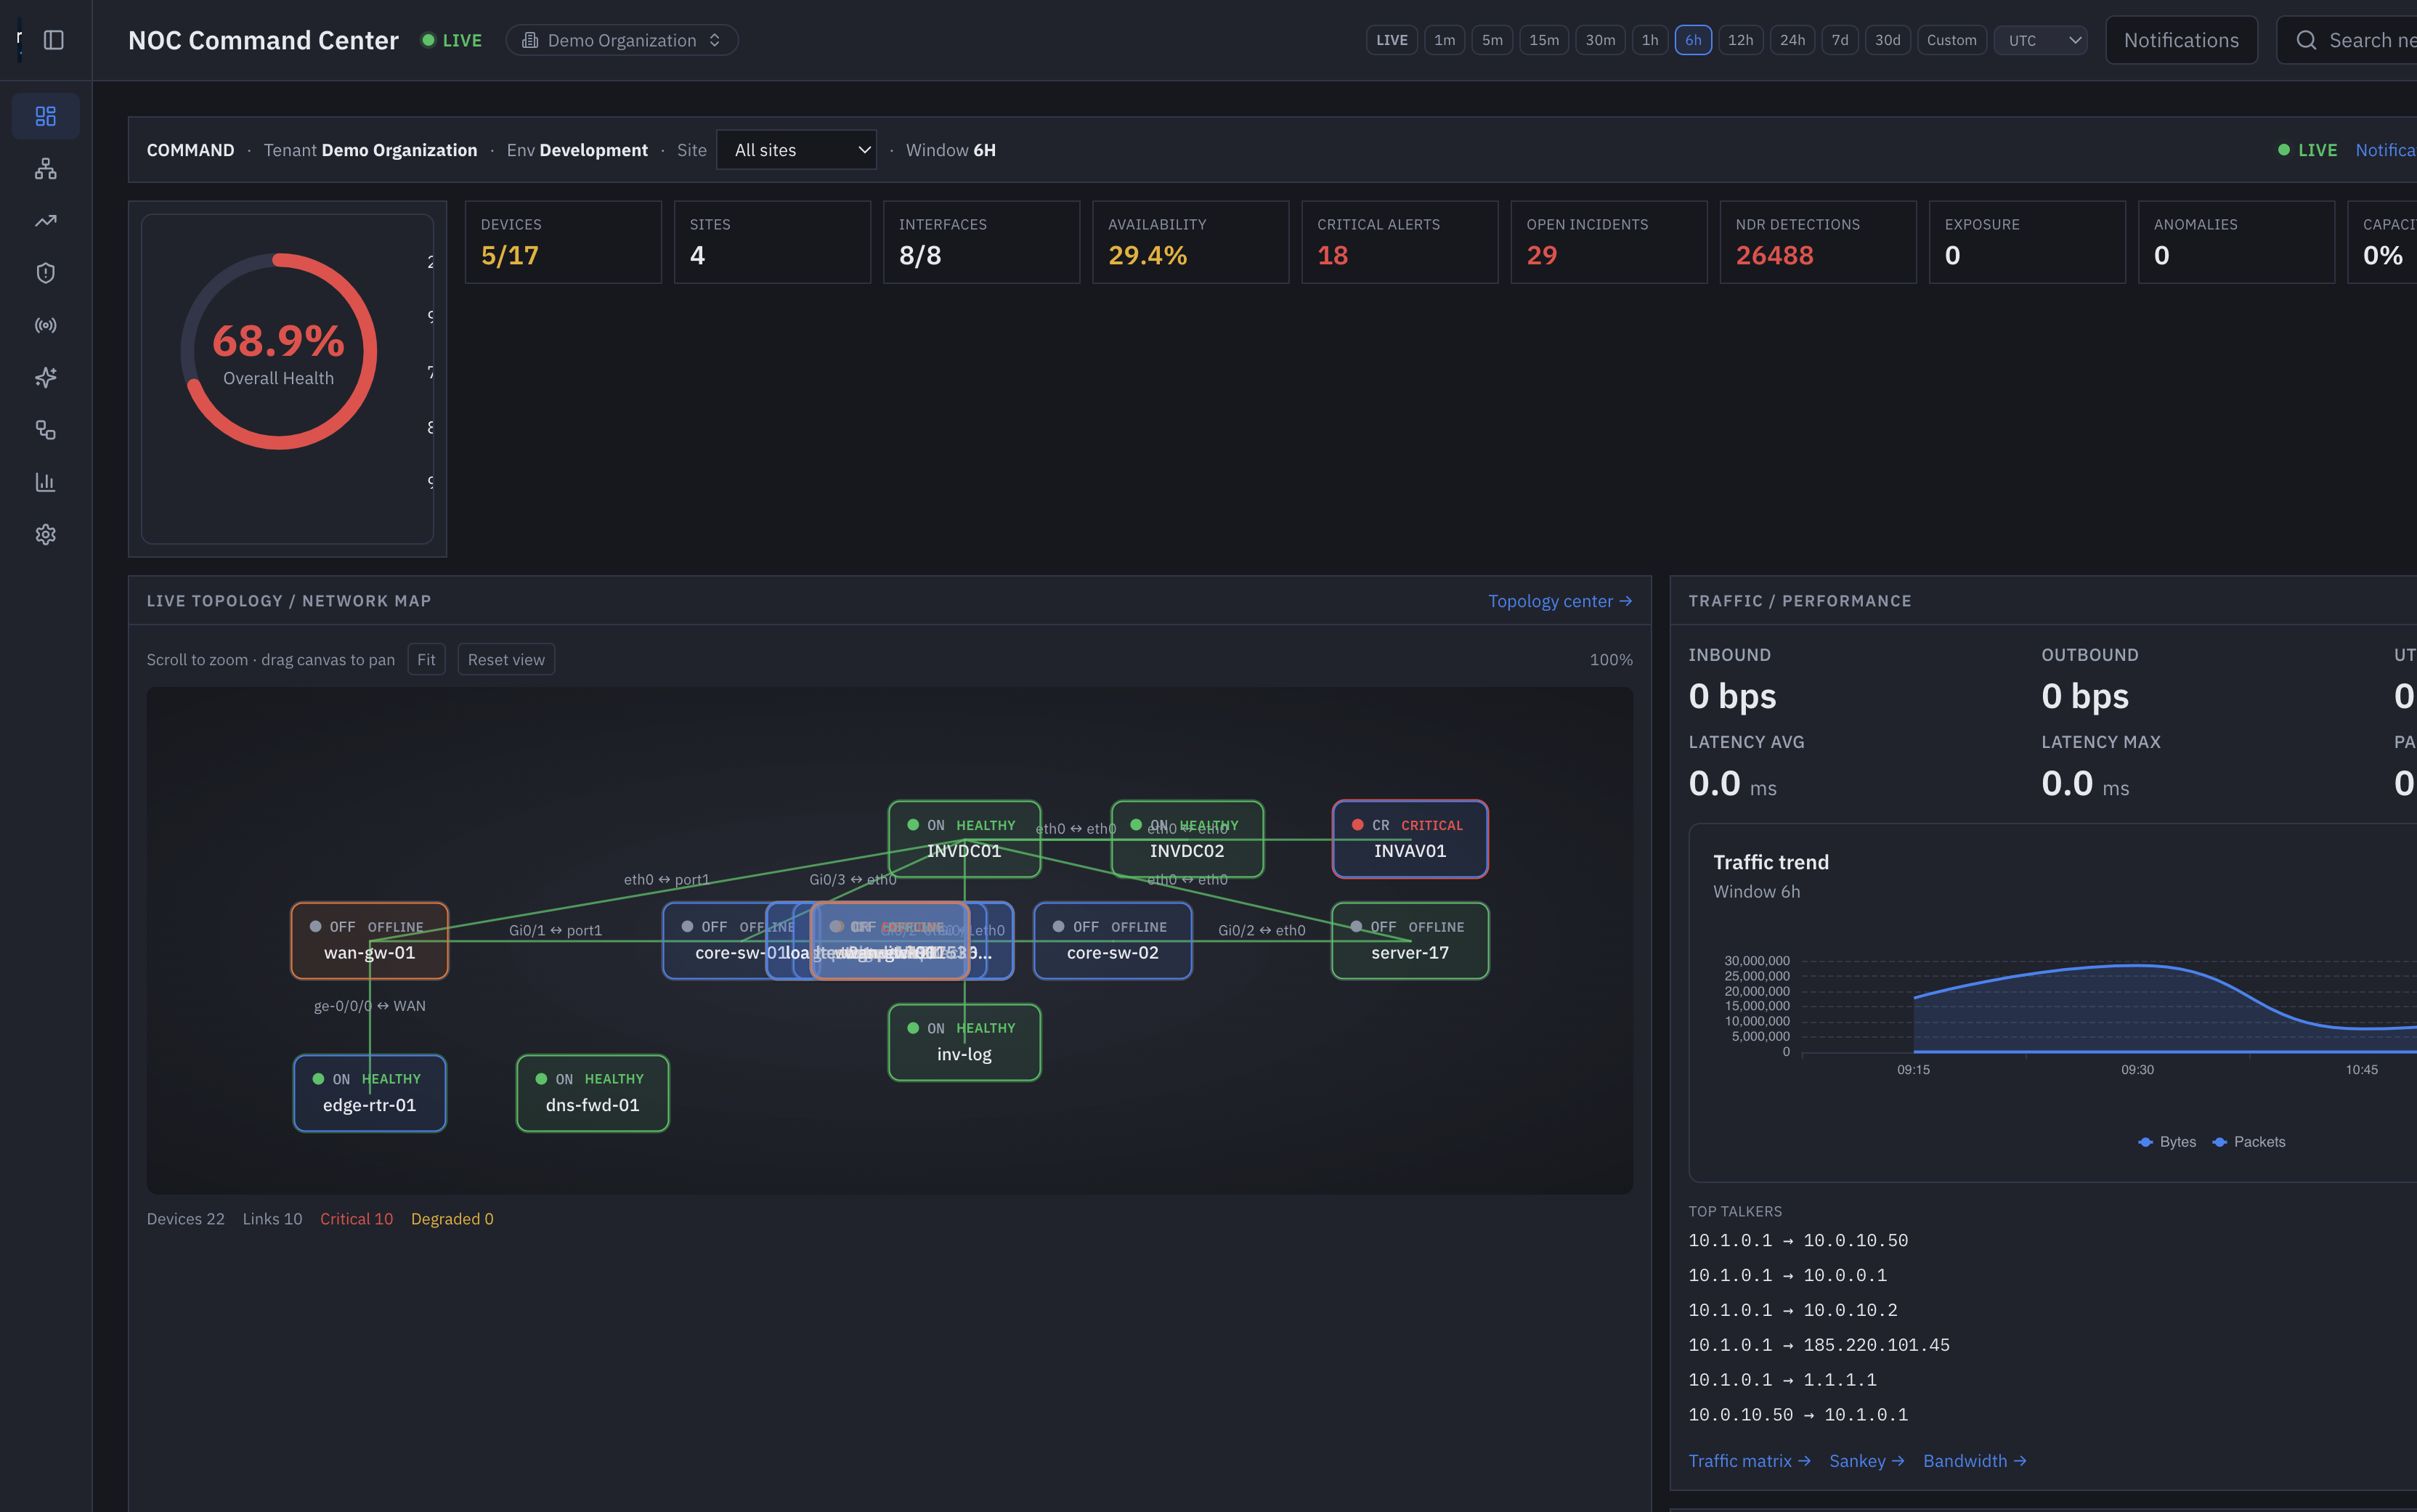
NOC Command Center
One live operating picture for health, topology, traffic, detections, incidents, and site status — built for operators who cannot context-switch across six tools.
- • Live topology with device and link health
- • Critical alerts, incidents, and NDR detections in one wall
- • Site, collector, and availability KPIs from the same session
Learn more →NMS
Enterprise Network Monitoring
Edge-collected SNMP, ICMP, syslog, and trap telemetry into a real inventory with device lifecycle, groups, dependencies, and explainable health.
- • Device lifecycle from discovered to monitored, maintenance, or decommissioned
- • Interface, availability, and collector health without invented green scores
- • Monitoring profiles, device groups, and synthetic checks
Learn more →Traffic & Flow
NetFlow, IPFIX, and sFlow intelligence
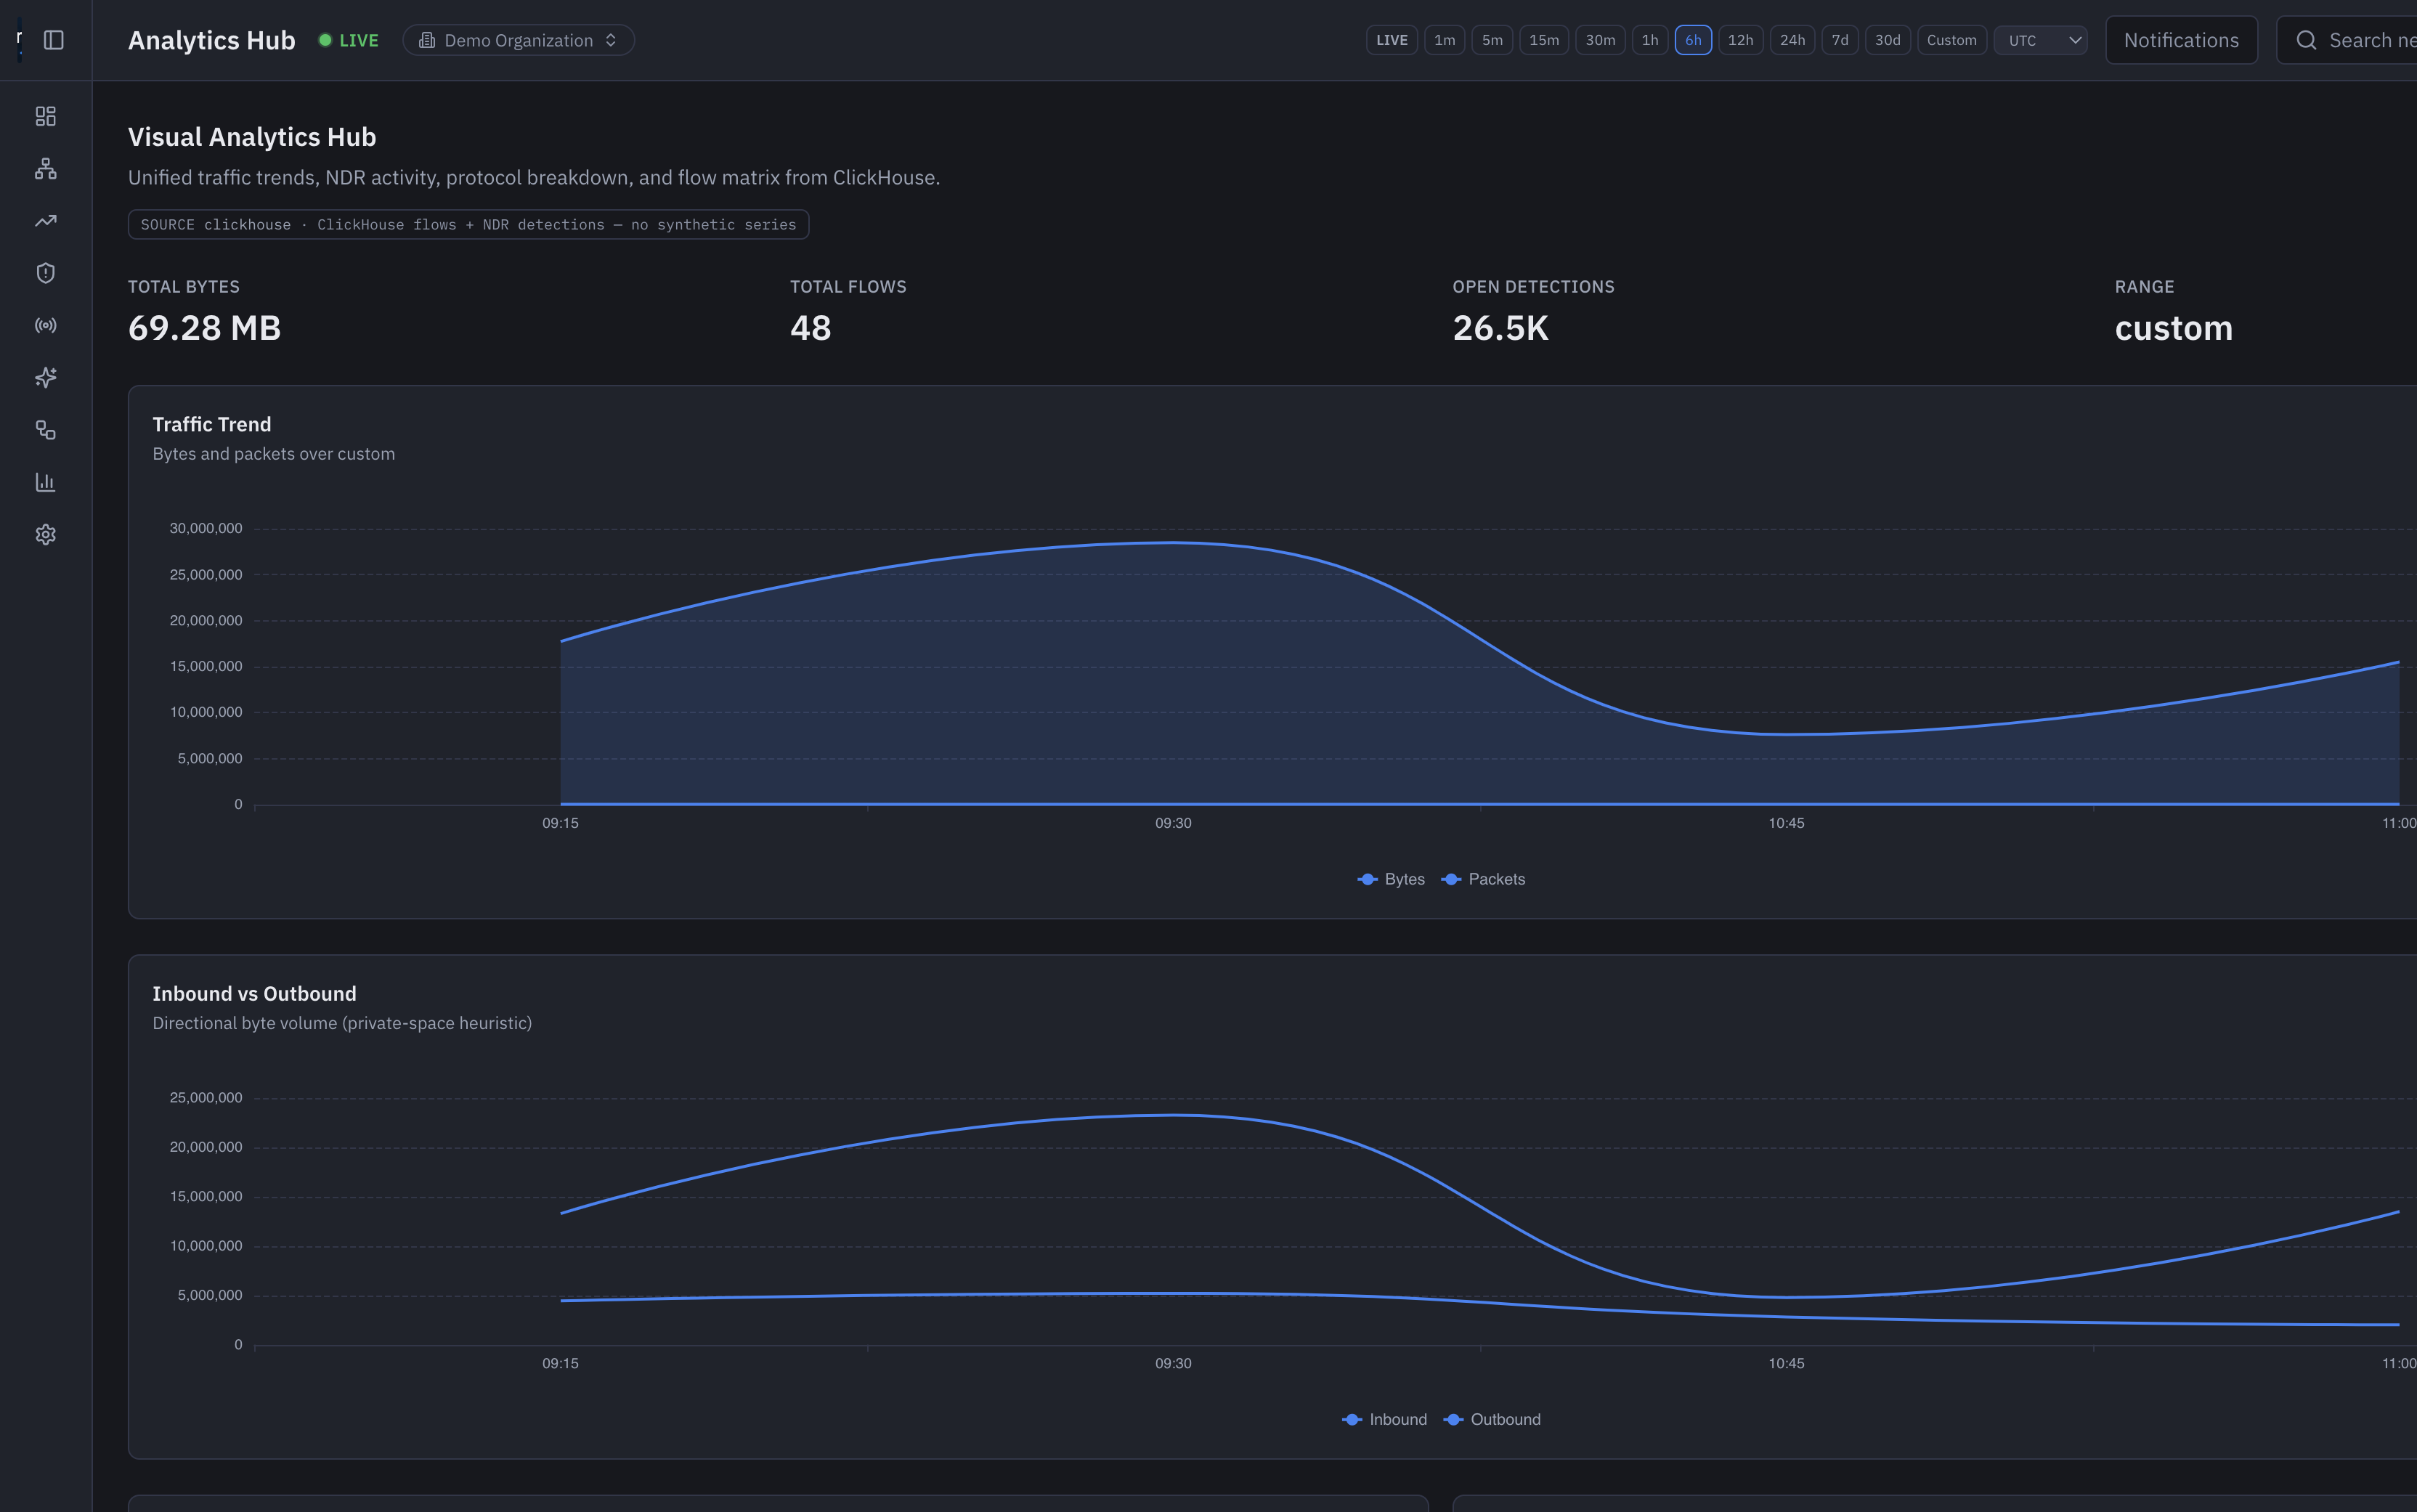
Turn high-volume flow telemetry into conversations, top talkers, application demand, traffic matrices, and Sankey paths operators can actually use.
- • ClickHouse-backed flow analytics at investigation speed
- • Top talkers, applications, conversations, and WAN/cloud egress
- • Visual analytics hub for trends, protocol mix, and bottlenecks
Learn more →NDR
Network Detection and Response
Detect, investigate, and respond on network telemetry — sessions, detections, hunting, evidence, and action — without pretending to be a SIEM or EDR.
- • Behavioral, IOC, and threshold detections on live network sessions
- • Alert analysis, investigations, evidence, and response workflows
- • Threat map, C2, lateral movement, and session hunting in the same product
Learn more →AIOps
AIOps, RCA, and Copilot
Correlate noise, surface anomalies, trace likely root cause, and ask the AI Network Command Center for the next operational step.
- • Anomaly detection, correlation, and service-impact views
- • Root-cause analysis tied to topology and dependency context
- • AI Copilot for investigation summaries and recommended actions
Learn more →Automation
Guided network automation
Turn repeatable NOC and NDR decisions into playbooks, approvals, jobs, and auditable execution — with human control on sensitive changes.
- • Playbooks, templates, and scheduled jobs
- • Approval gates for operational and security-sensitive actions
- • Execution history for accountability across tenants
Learn more →Topology
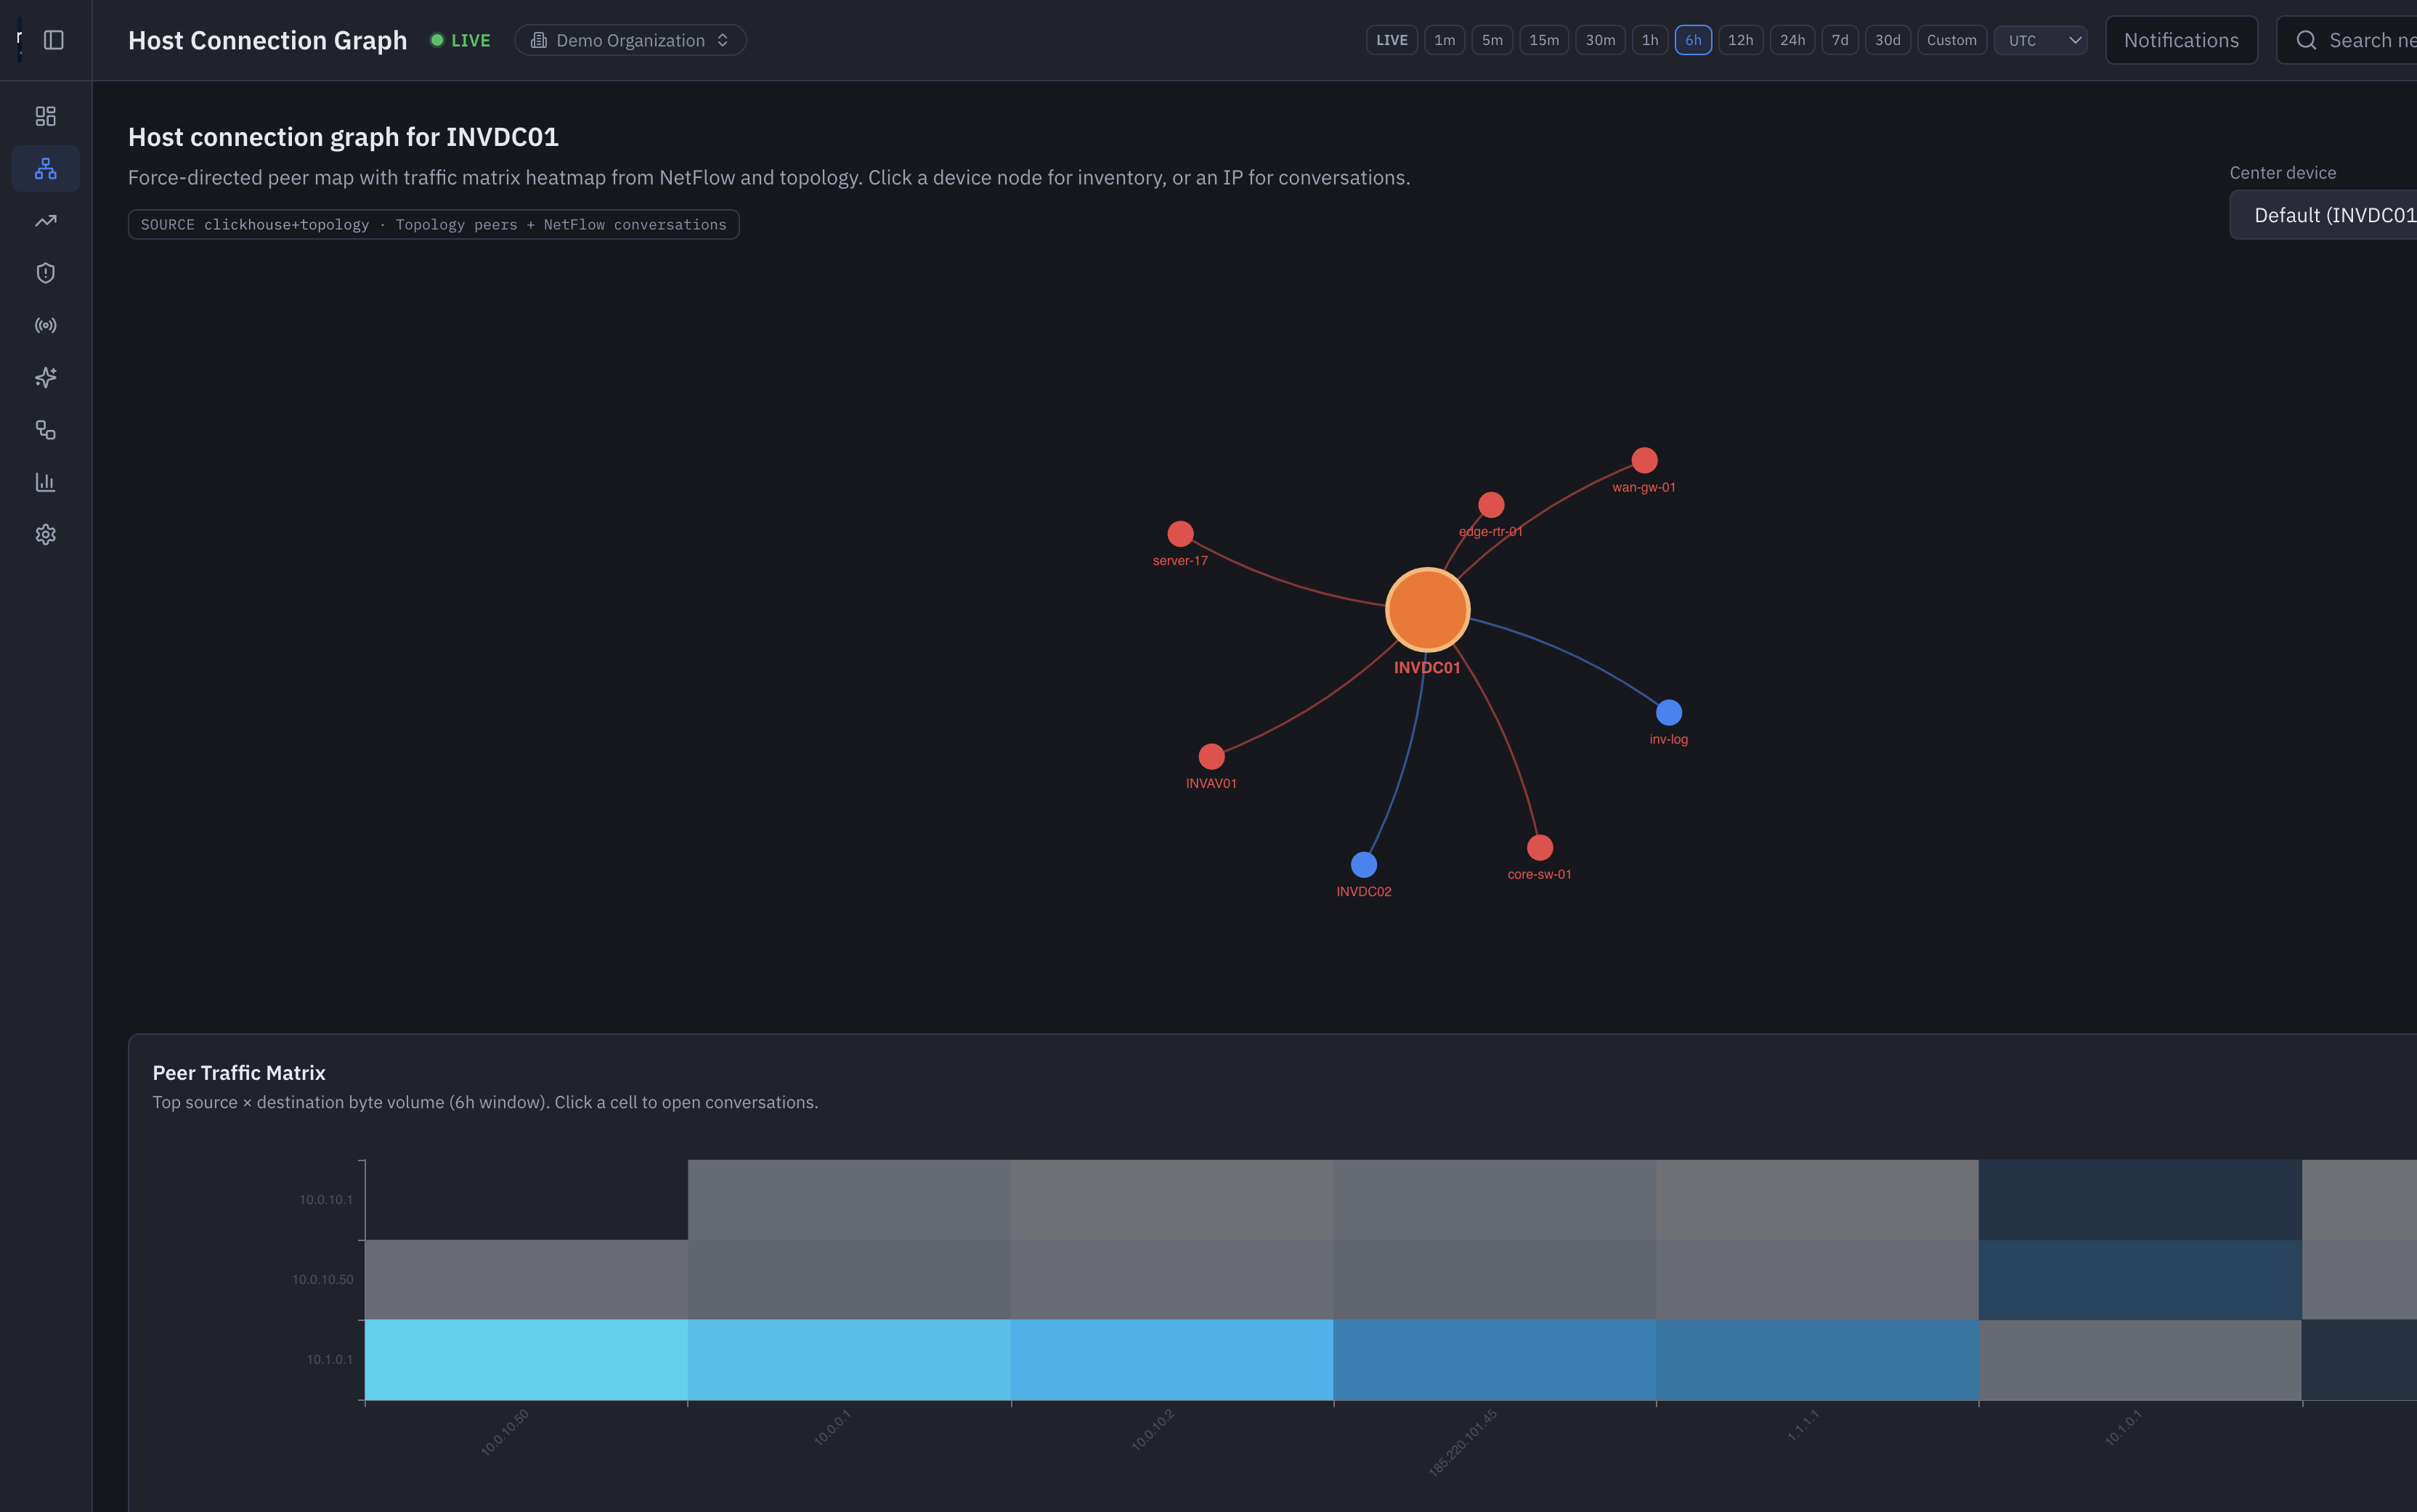
Live topology and host graphs
LLDP/CDP discovery, inventory sync, and NetFlow conversations on one map so a red device opens into peers and paths instead of a static drawing.
- • Live health overlays on devices and links
- • Host-centered peer maps with traffic matrices
- • Unified graph across sites and dependencies
Learn more →NEM
Network Exposure Management
Inventory internet-facing risk, vulnerabilities, misconfigurations, and attack paths on the same graph the NOC already uses.
- • Exposure inventory, assets, and internet surface
- • Vulnerability and misconfiguration views
- • Risk analysis and attack-path context
Learn more →Analytics
Reporting and executive views
SLA, capacity, traffic, and NDR activity from VictoriaMetrics and ClickHouse — the same stores operations already trust.
- • Visual analytics hub for trends and protocol mix
- • Capacity forecast and SLA analytics
- • Executive dashboards without a weekend CSV export
Learn more →